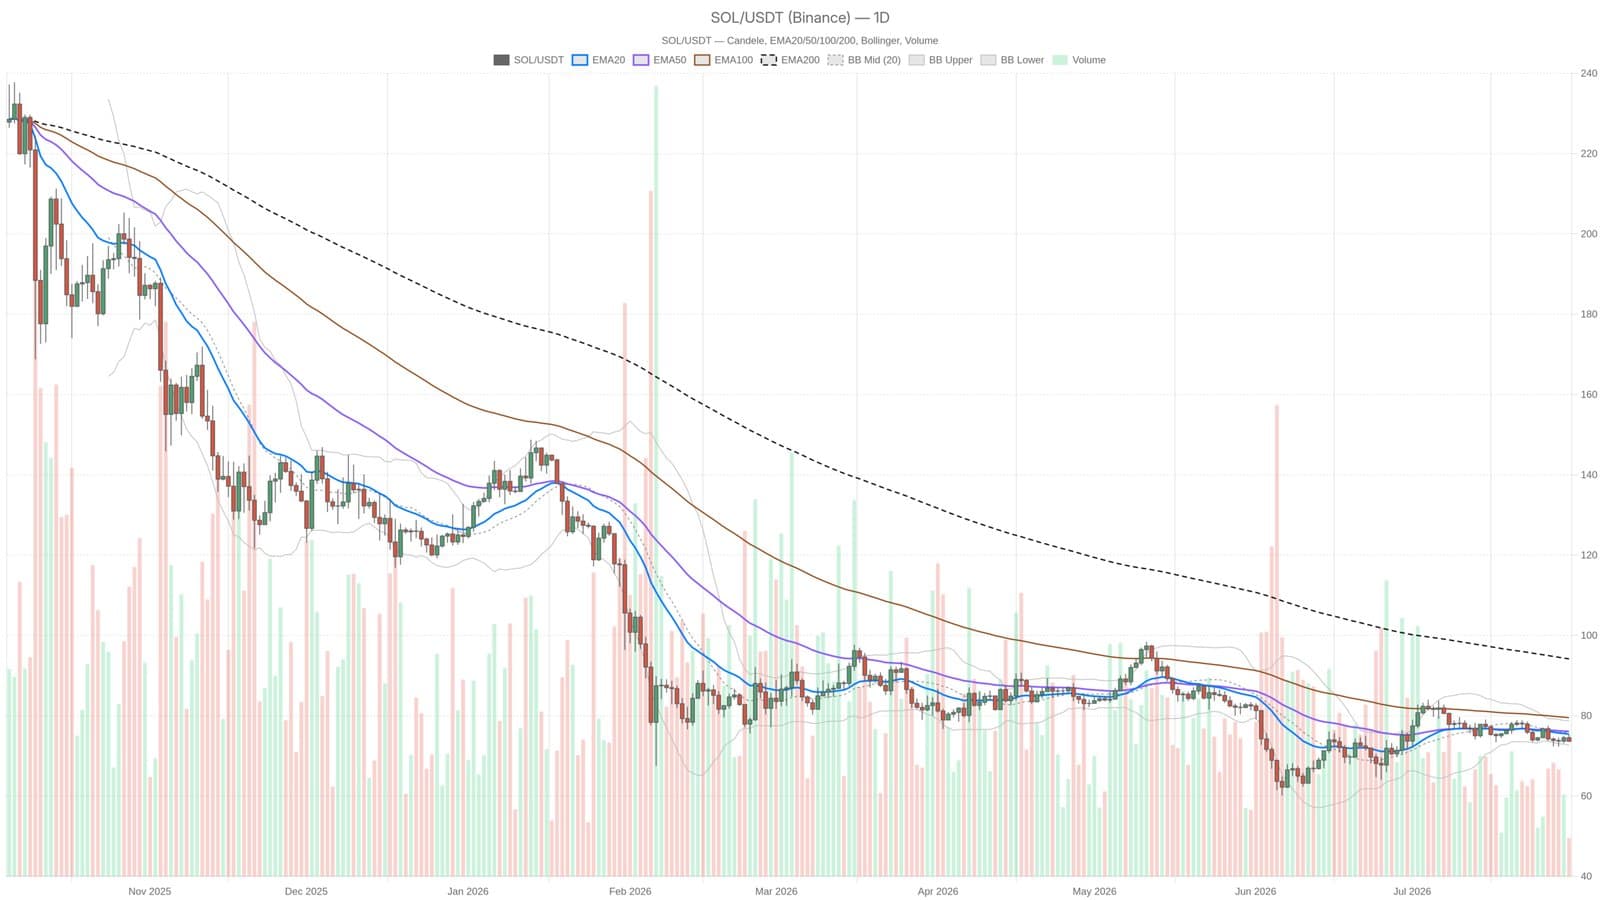
Solana’s price lingered at $73.62 on July 31, failing to break past key moving averages and hovering more than $20 beneath its 200-day EMA. Bears have a firm grip with every rebound capped, leaving SOL trapped below major resistance levels.
The daily chart paints a bleak picture. SOL trades under the EMA20 at $75.40, EMA50 at $76.08, and the EMA200 at $94.16 a wide gap signalling a significant downtrend. This distance from the longer-term mean highlights how much the token has fallen, with little indication of a rally strong enough to close it. The RSI sits at a middling 43.8, lacking buying pressure but not oversold enough to lure investors looking for value. Meanwhile, the MACD line crossed below its signal, reinforcing the bearish momentum and hinting that selling pressure may intensify.
Adding to the gloom, recent data from Solana’s decentralized exchanges show a sharp drop in fees generated. Orca’s on-chain fees plunged by over 50% in the past month, while PumpSwap’s fees fell roughly 28% over 24 hours. This decline in network activity coincides with the price slump, reflecting reduced user interest and transactional volume. If Solana closes below $72.99, sellers could gain control fast, pushing the token lower. Recovering above $75.40 is the bare minimum for bulls to even consider regaining footing.
The bearish trend is reinforced by Bollinger Bands pressing SOL toward their lower range, a sign that the decline might continue rather than reverse. With no RSI divergence or bullish hidden indicators on the daily chart, the technical setup suggests that Solana’s slump may persist in the near term.
Ethereum’s similar struggles below key levels reveal the broader market’s sentiment of caution. The lack of momentum across the board is keeping crypto prices subdued.
This material is for informational purposes only and does not constitute financial advice.