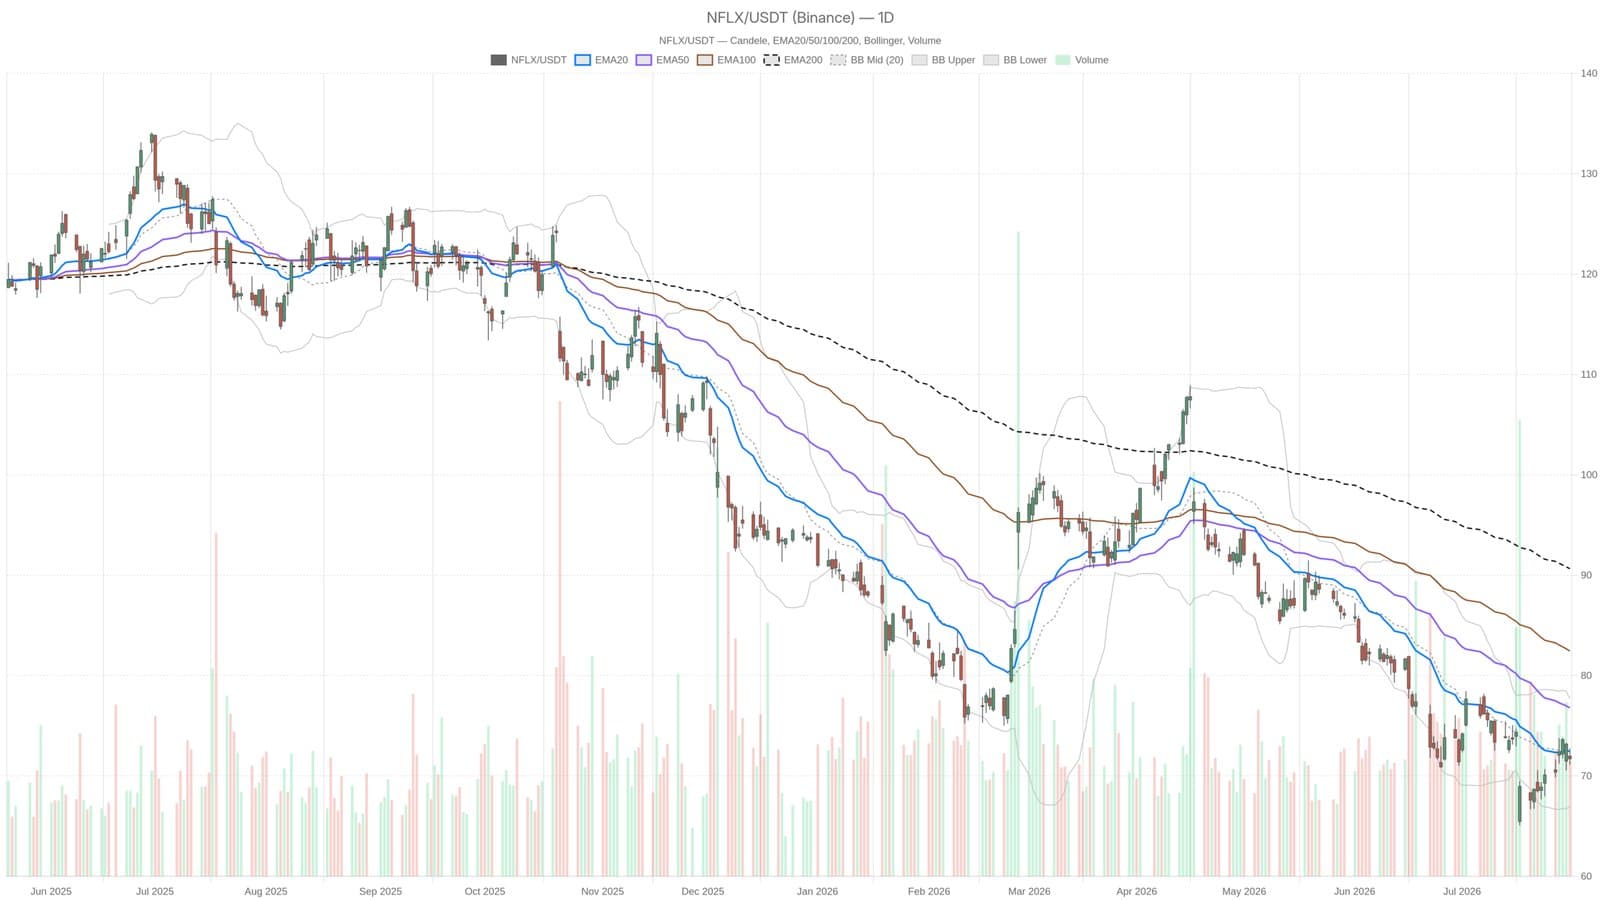
Netflix stock fell to $71.71 at the end of July, hitting its lowest point in 52 weeks. This decline places the shares about 43% below their highest level over the past year. The stock remains under pressure, trading below key moving averages the 20-day at $72.46, 50-day at $76.77, and 200-day at $90.64 reinforcing a bearish trend.
Despite the company beating earnings expectations for the second quarter, investors reacted negatively as Netflix’s guidance showed signs of slowing growth and its free cash flow declined. This cautious outlook has kept selling momentum strong, even though some technical indicators hint at a possible easing of the downward push. The Relative Strength Index (RSI) sits at 44.6, indicating sellers still dominate but momentum is not intensifying. Meanwhile, the MACD shows a negative trend, but a positive histogram suggests the pace of selling might be slowing.
Critical Price Points Signal Next Moves
In shorter time frames like hourly and 15-minute charts, Netflix’s price appears to be consolidating within a narrow range. Key levels include resistance at $72.60 and support near $70.96. A break in either direction could set the tone for the stock’s near-term trajectory.
According to Seeking Alpha, the stock’s sharp decline after earnings highlights how investor sentiment has shifted despite the earnings beat. Yahoo Finance and The Motley Fool have noted Netflix’s shares are down nearly 46% from recent highs, a substantial revaluation that matches the ongoing technical downtrend.
Investors should watch these technical and fundamental cues closely to gauge whether Netflix can stabilize or if the selling will persist.
This material provides information only and should not be considered financial advice.