Western Digital reported better results than Wall Street expected, then watched its stock crater 45 dollars in a single session. The jump from 564.66 to 519.17 represents the kind of move that shakes retail traders awake at 3 AM. Earnings beat by 6.27 percent, revenue topped forecasts by 1.14 percent, and somehow that triggered a selloff instead of a rally.
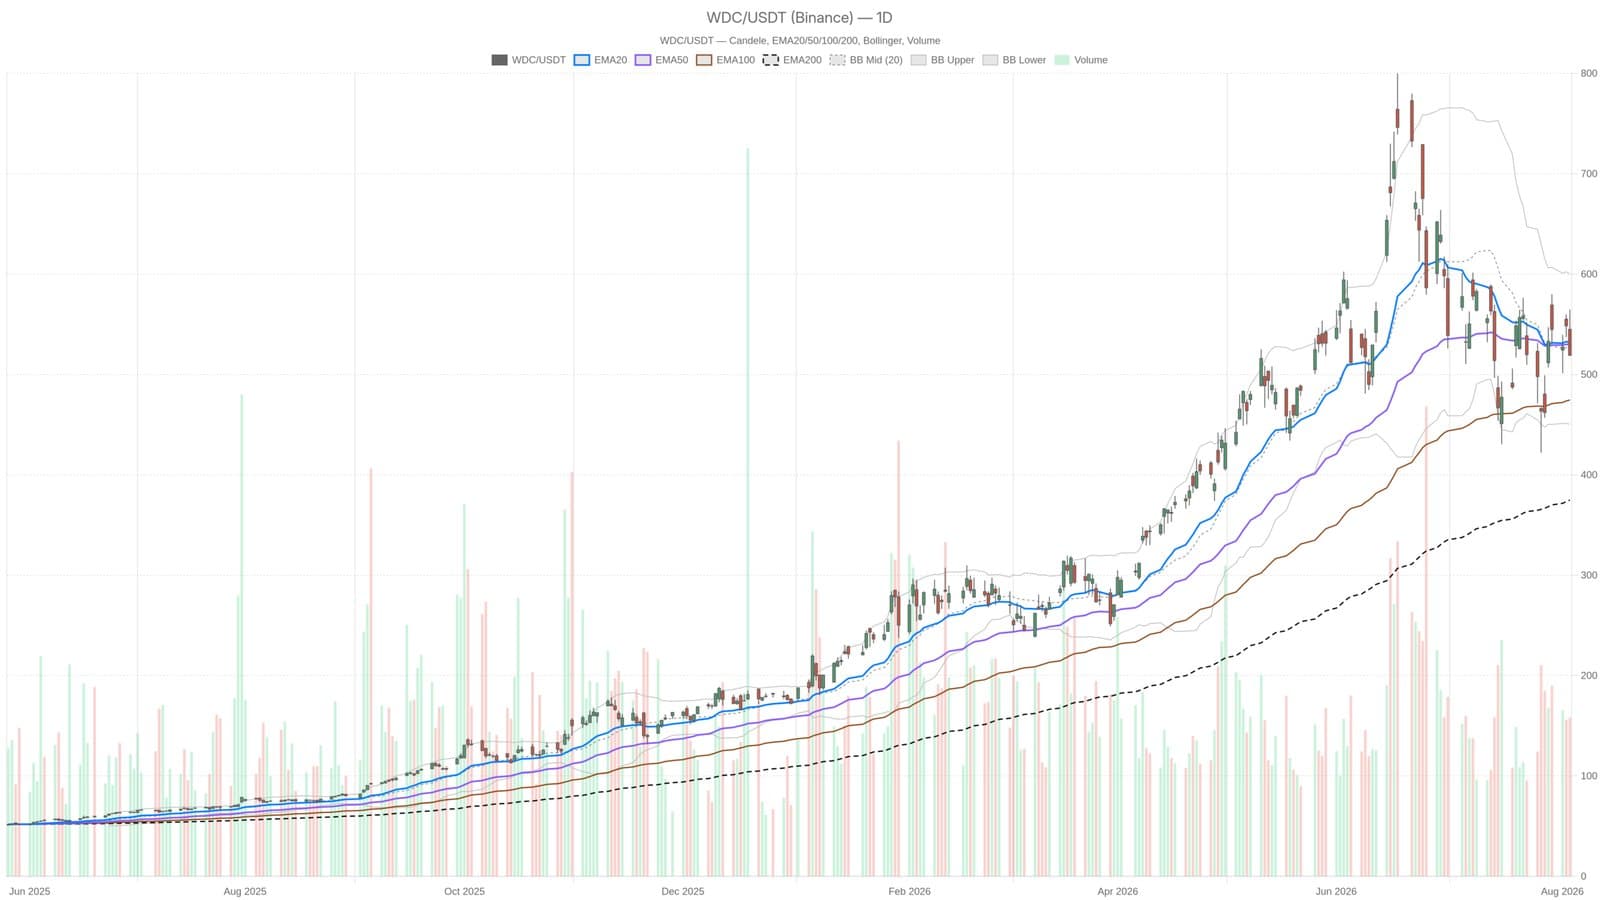
The chart tells the story of what happens when good news doesn't land the way investors imagined. Price is now trading below both the 20-day and 50-day moving averages at 531.48 and 529.53 respectively. That's the kind of technical damage that usually catches sellers' attention. However, the 200-day average sits at 374.83, still well below current levels, which means the longer-term trend remains intact despite the short-term thrashing.
What's actually interesting is the momentum picture underneath the surface. The RSI is sitting at 47.65, which is neutral territory, not oversold. The MACD histogram turned positive at 3.23, a signal that bearish momentum is actually narrowing rather than gathering steam. That means the selling pressure that hit immediately after earnings might be losing muscle.
Volatility exploded. The ATR14 reading of 50.23 confirms we're in a genuinely elevated regime where moves can swing big and fast. Bollinger Bands stretched wide from 450.44 to 599.98 around a midline of 525.21. Next, traders will watch whether the stock holds support at 503.41 or bounces back toward the daily pivot at 534.04. That 30-point range becomes the battleground that determines whether this was a shakeout within an ongoing uptrend or the start of something deeper.
This material is for informational purposes only and should not be construed as financial advice or investment guidance. Markets move on sentiment and technicals, and past price action does not guarantee future results.