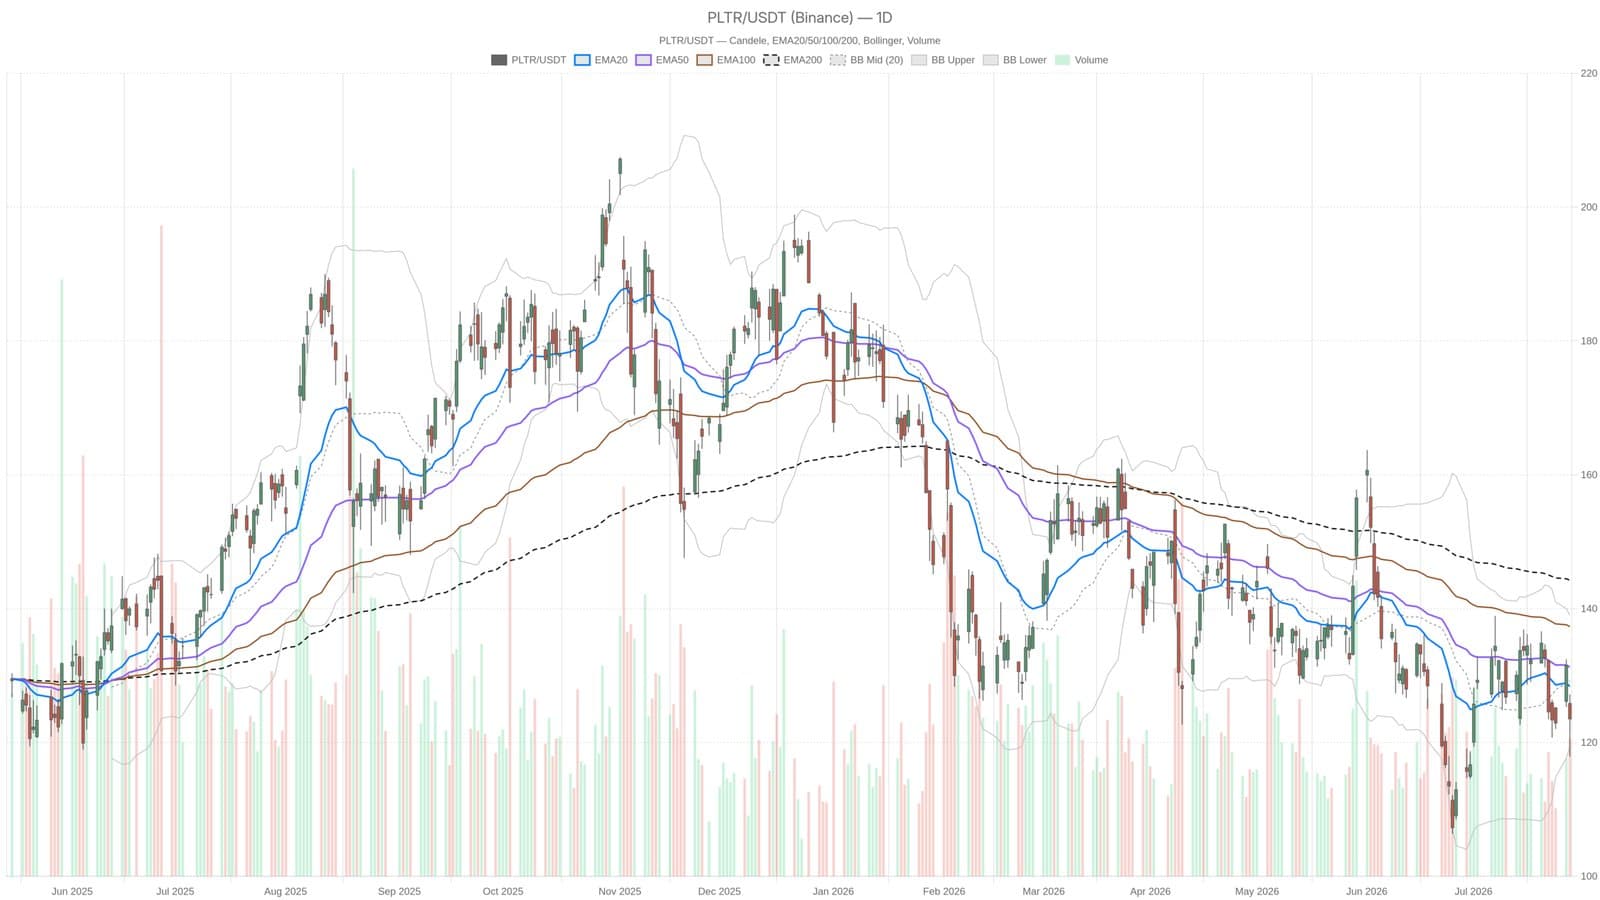
Palantir’s shares fell to $123.53 on July 28, dropping below all major exponential moving averages (EMAs) including the 20-day at $128.38, the 50-day at $131.26, and the 200-day at $144.26. This technical descent sets a bearish tone just days before the company’s earnings release on August 3, intensifying pressure on the stock.
Technical Weakness Dominates Palantir’s Chart
On the daily chart, the trend is unmistakably negative. The price remains under every critical EMA, signaling a classic distribution phase where selling outweighs buying. Momentum indicators confirm the downtick: the Relative Strength Index (RSI) stands at 44.5, comfortably within bearish territory but not yet oversold, implying potential further downside. The Moving Average Convergence Divergence (MACD) shows a confirmed bearish crossover with its line at -0.82 below the signal line at -0.44, reinforcing the downward momentum.
Market Volatility and Earnings as Potential Catalysts
Palantir’s stock closed near the lower Bollinger Band at $119.45, well below the midline of $129.22, indicating persistent selling pressure. The Average True Range (ATR) measures 7.04, suggesting daily price swings of about $7, which could widen around earnings. Despite the bearish setup, the $200 price target and the long-term $1 trillion valuation narrative remain alive, hinging largely on the results due next week.
Investors will be watching closely if Palantir’s earnings can reverse the current technical weakness or if the downtrend will deepen. The stock’s performance could also echo broader fintech and market movements seen in recent reports like Visa’s quiet push into AI and stablecoins, highlighting how tech-driven companies face shifting investor sentiment amid macroeconomic uncertainty.
This content is for informational purposes and does not serve as financial advice.