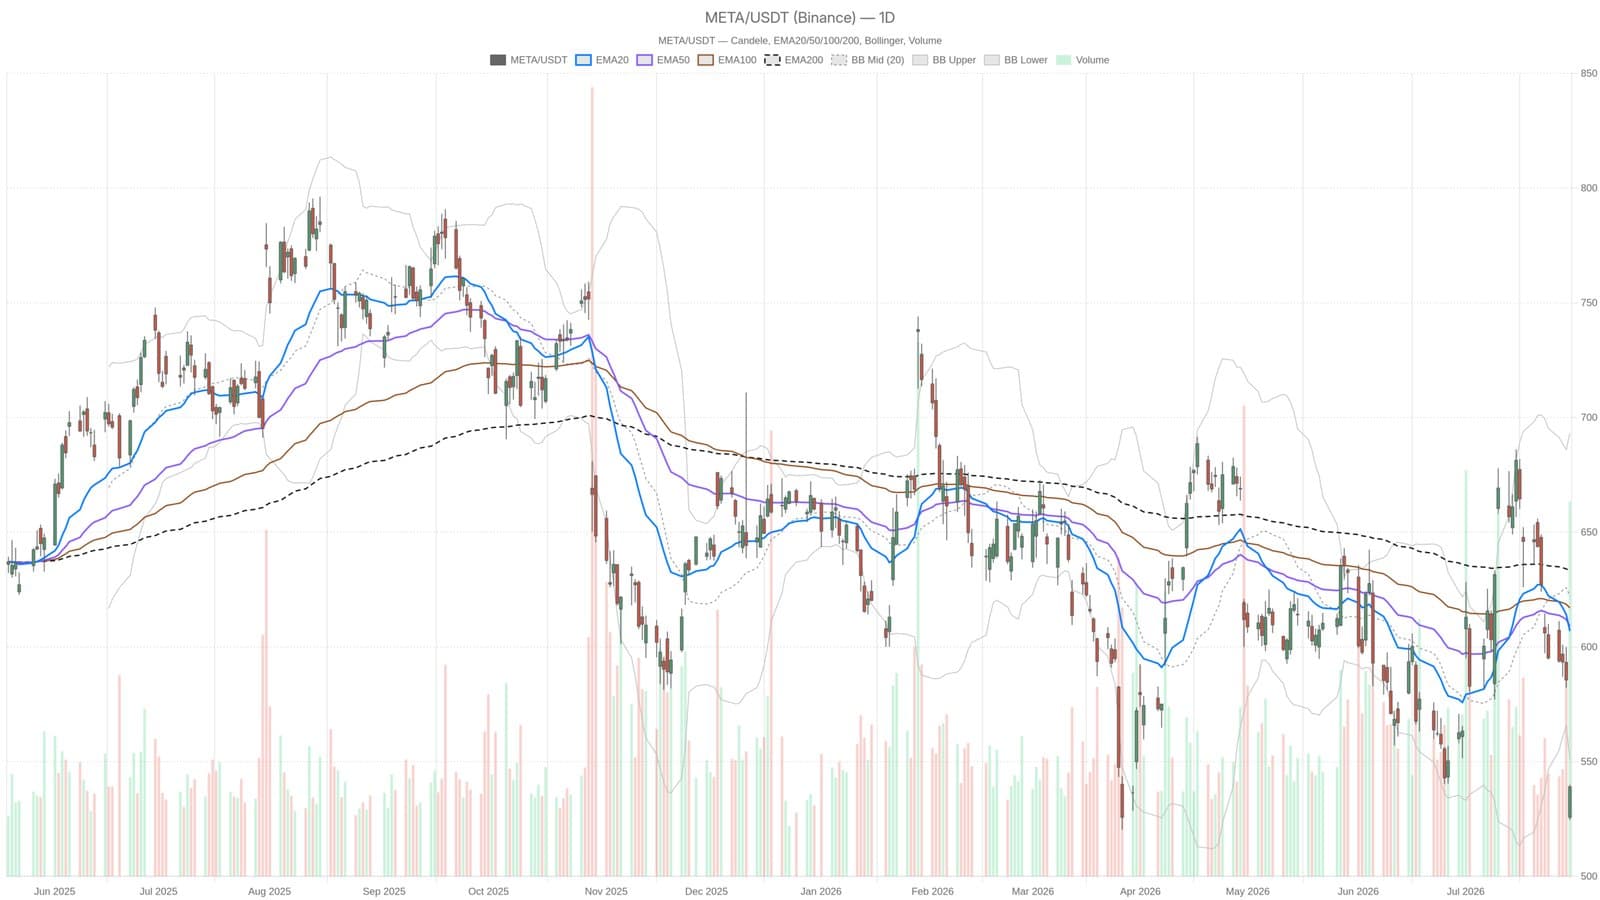
Meta's stock took a sharp hit following its disappointing Q2 earnings report, dropping to close at $539.03 on July 30. The fall marked a significant break below multiple key technical levels and intensified the bearish trend that had been shaping up over recent weeks.
The company missed profit expectations and warned investors about increased spending on artificial intelligence initiatives, which spooked the market. The stock now trades over $90 below its 20-day exponential moving average (EMA), highlighting the depth of the selloff.
Technical Breakdown Signals Persistent Selling Pressure
On the daily chart, Meta's price sits well below all major EMAs: the 20-day at $606.93, the 50-day at $609.05, and the 200-day at $633.06. This alignment is a classic indicator of sustained distribution and long-term selling dominance. The daily Relative Strength Index (RSI) hovering around 32.11 approaches oversold levels but doesn’t guarantee a reversal anytime soon, as oversold conditions can persist during strong downtrends. The Moving Average Convergence Divergence (MACD) histogram reading at -10.86 further confirms entrenched bearish momentum. Intraday, the hourly RSI dropped to a stark 22.91, underscoring heavy intraday pressure.
Support levels are fragile, with $529.07 acting as a key point, and the session low of $524.52 marking a near-term floor. Meta’s struggle follows broader market caution toward tech stocks ramping up AI spending, a theme also reflected in South Korean chip stocks soaring on renewed AI memory demand as companies prepare for increased AI workloads (South Korean chip stocks soar on renewed AI memory demand).
Meta’s current chart pattern and earnings results suggest the stock is facing a critical phase where further downside or prolonged stagnation could unfold as investors digest both the profit miss and the cost implications of AI investment.
This content is for informational purposes only and does not constitute financial advice.