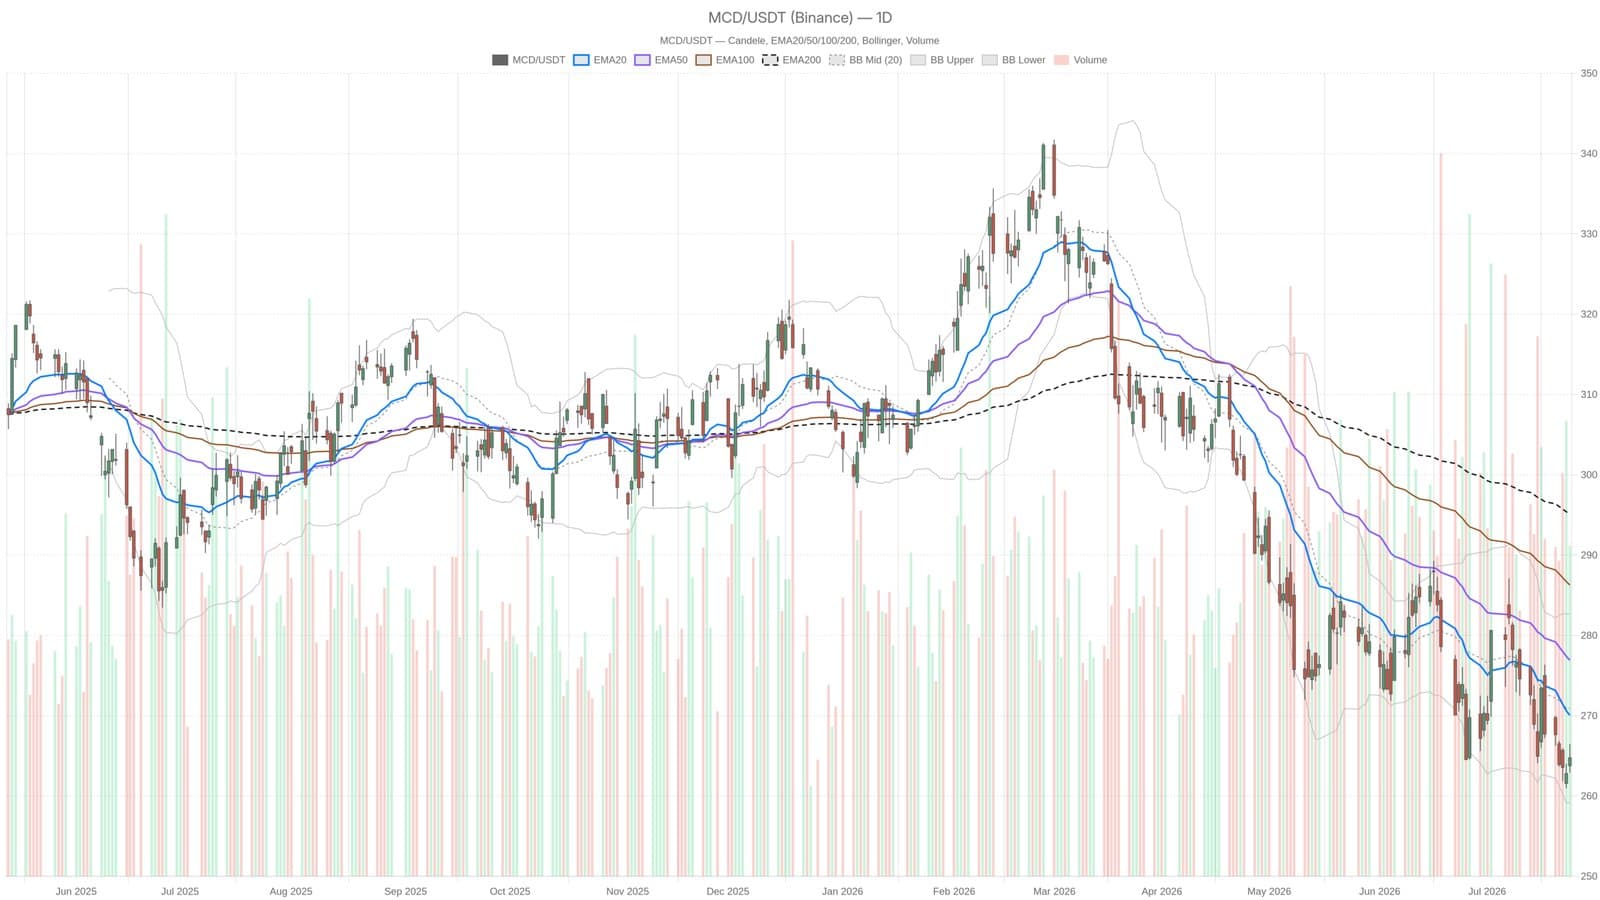
Shares of McDonald’s Corporation plunged sharply, nearing their lowest price in a year amid increasing selling pressure. On July 24, MCD stock closed at $264.76, just above the recent 52-week low of $261.41. The trading action shows the stock stuck well below key moving averages, signaling a deeply bearish trend.
Technical Indicators Highlight Bearish Sentiment
McDonald’s shares are trapped under the 20-day, 50-day, and 200-day exponential moving averages, positioned respectively at $270.06, $276.91, and $295.10. This layered resistance leaves little room for buyers to step in confidently. The daily Relative Strength Index (RSI) at 41.31 points to sustained downward momentum with some space left before hitting oversold conditions, meaning further declines are still possible. Meanwhile, the MACD histogram is extending its drop, indicating that selling pressure is intensifying rather than weakening.
On the intraday front, volatility remains moderate with an average true range around $5.54, reflecting meaningful price swings that add risk to attempts at counter-trend trades. The stock’s daily pivot price near $264.71 creates a narrow range with short-term resistance at $266.51 and support at $262.95. Hourly charts suggest a slight pause in selling pressure, with prices rebounding toward the 20-hour EMA at $264.42, but resistance around $266 limits upside potential.
Despite the bearish technical signals, McDonald’s declared a quarterly dividend of $1.86 per share, payable September 16, 2026. This payout provides some income support for investors amid the stock’s recent weakness. Traders should watch if MCD breaks below the $261.41 floor, which would expose a lower Bollinger Band boundary at $259.20 and could trigger further declines.