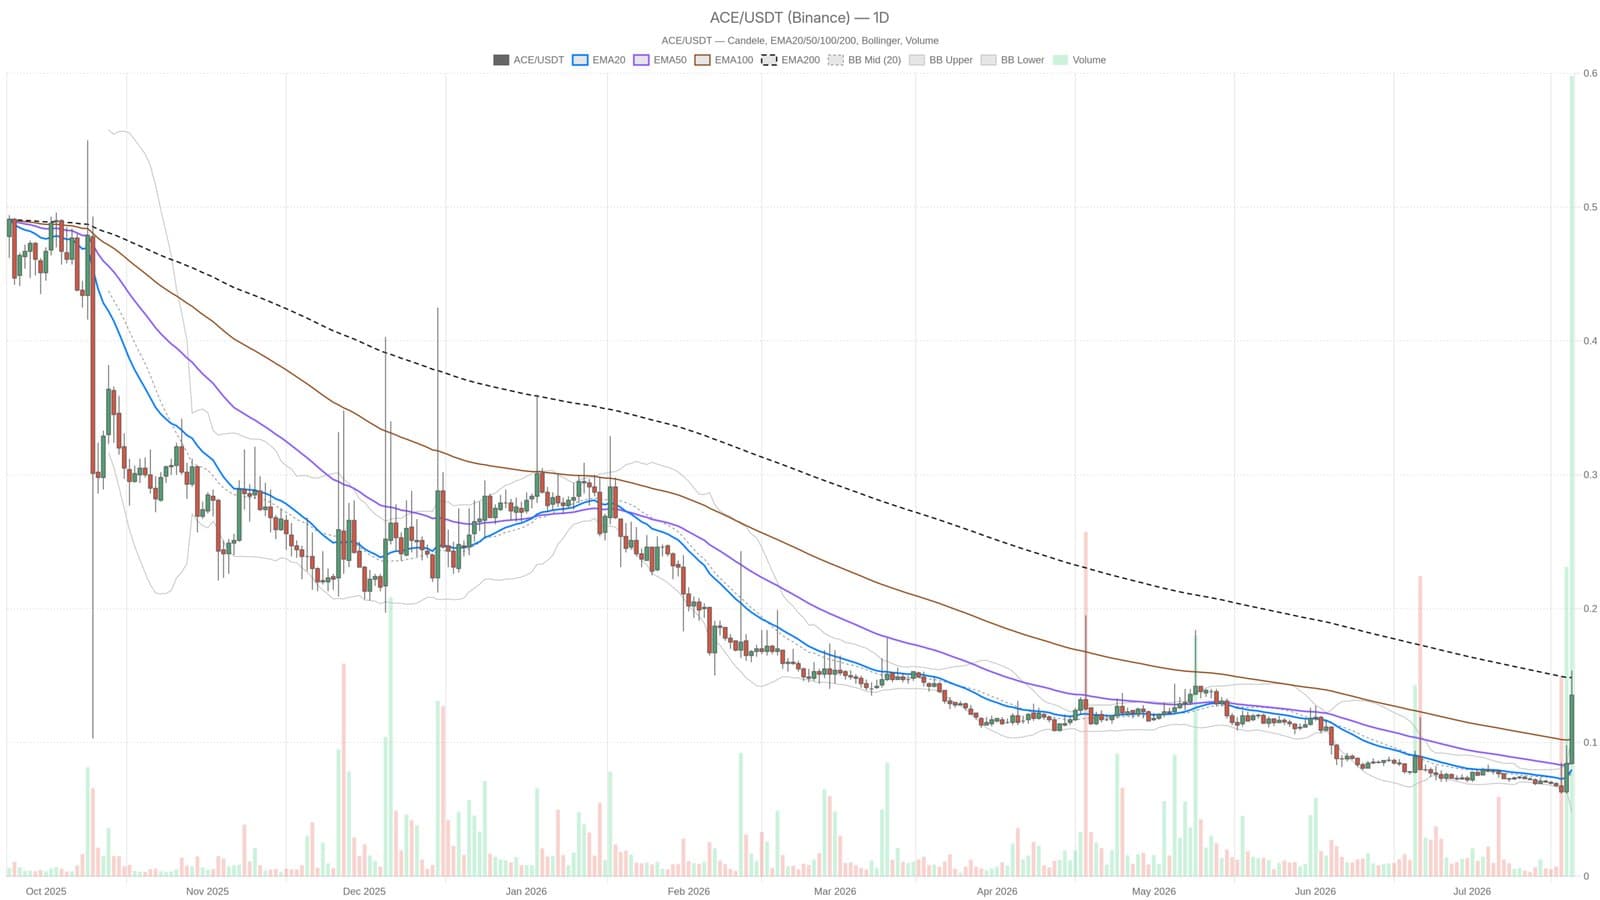
Fusionist token ACE/USDT is currently priced at $0.14, hovering just below a key technical barrier at $0.15 marked by the daily EMA200. This level constrains upside potential to about 14%, while downside risk looms at roughly 40% if the price fails to break through resistance.
Technical Indicators Show Overbought Conditions
The daily Relative Strength Index (RSI) for ACE/USDT stands at an elevated 80.88, indicating the asset is overbought and vulnerable to a correction. Despite the recent strong rally pushing past short-term moving averages like the EMA20 at $0.08 and EMA50 at $0.09, the price is well above the upper Bollinger Band at $0.11, suggesting momentum may be overstretched. The average true range (ATR) of $0.01 underlines that daily price swings remain small in absolute terms, but percentage-wise, the token is showing volatility.
Market Context and Structural Resistance Levels
The $0.15 EMA200 and the first resistance (R1) at $0.16 create a narrow ceiling just above the current price, where sellers are likely to intensify pressure. A confirmed break above $0.16 would shift the long-term outlook to bullish, but failure to hold above $0.15 could drive the price down toward the $0.09 support level. Broader market signals provide a cautious backdrop: Bitcoin dominance sits at 56.5%, implying risk appetite favors large-cap cryptocurrencies over smaller tokens like ACE. also the Fear & Greed Index is at 29, reflecting prevailing market fear rather than euphoria.
This combination of overbought technicals and a cautious market environment makes new long positions risky. The reward-to-risk ratio favors a downside move near 40%, while upside gains are capped near 14%. Traders should consider these factors carefully before entering fresh positions.