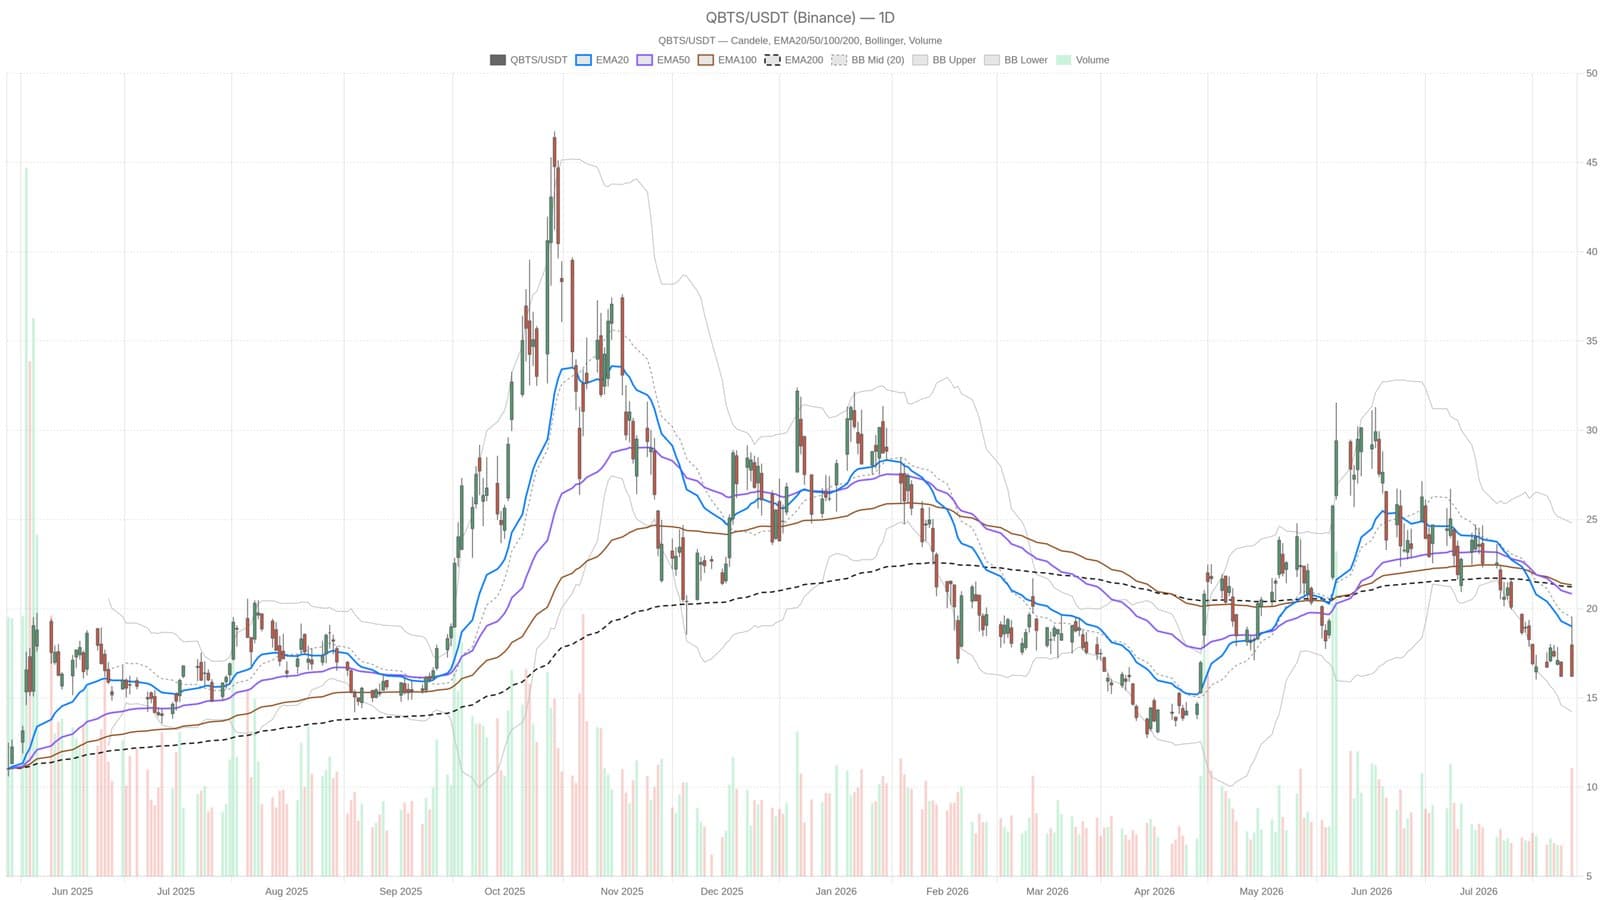
D-Wave Quantum Inc. stock experienced a rapid price jump to 19.54 on July 27, driven by news of an expanded partnership with AT&T. However, the rally was short-lived as shares closed significantly lower at 16.21, reflecting ongoing bearish pressures.
Intraday Spike vs Daily Downtrend
The intraday peak on July 27 marked a sharp contrast to the stock's overall daily performance. Despite the spike, the closing price settled well below all major moving averages, signaling persistent weakness. The 20-day EMA stood at 19.01, the 50-day at 20.83, and the 200-day at 21.22, all above the closing price, confirming a bearish setup.
Technical indicators underline the negative momentum. The Relative Strength Index (RSI) hovered near oversold levels at 32.34 without showing signs of reversal, pointing to sustained selling rather than just a brief dip. Meanwhile, the MACD readings further emphasized the downtrend with a widening gap between the MACD line and signal.
Volatility and Resistance Levels
The average true range (ATR) of 1.34 highlights substantial daily price swings, making market timing key for traders. The stock closed below the daily pivot point at 17.32, confirming sellers controlled the session. Resistance lies near 18.43, a level the stock must surpass to suggest any meaningful recovery.
The short-term charts tell a more nuanced story. On the 1-hour timeframe, the RSI climbed into overbought territory at 71.72, and prices touched the upper Bollinger band around 19.81 during the spike, indicating a potential exhaustion of buying strength.
This volatility mirrors what we have seen in other tech sectors recently, such as the Nvidia stock drop following major financing news, highlighting how headlines can trigger sharp but fleeting market moves.
- Closed at 16.21 on July 27, clearly bearish on daily charts
- Intraday high of 19.54 after AT&T partnership announcement
- Key moving averages all above price, confirming downtrend
- High volatility with ATR of 1.34 indicates wide price swings
- Daily RSI near oversold, MACD showing increasing selling pressure
This material is for informational purposes only and should not be considered financial advice.