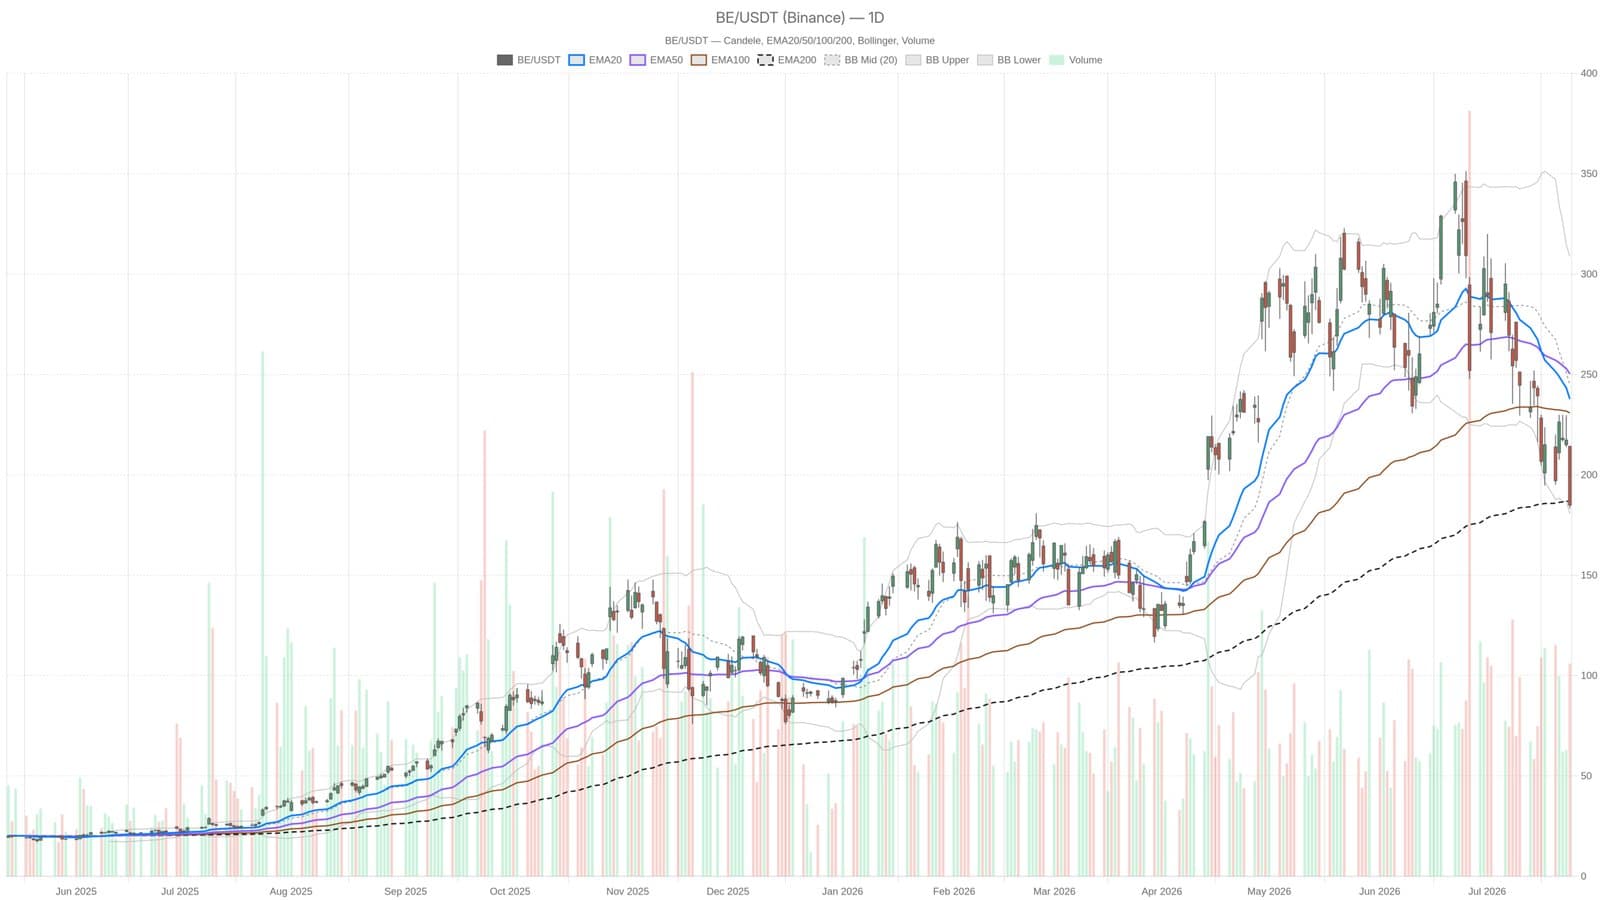
"The stock is teetering on the edge," one trader commented as Bloom Energy (BE) shares plunged 43% over the past month, closing at $184.89 on July 24. This places the price just above a key support level marked by the 200-day moving average at $186.84, highlighting a tense moment for investors waiting on the company's Q2 earnings report set for July 28.
The daily charts depict a steeply bearish environment. BE is trading well below both the 20-day and 50-day exponential moving averages, which now serve as significant resistance points at $237.78 and $250.27 respectively. The only remaining technical support is the 200-day EMA, precariously close to Friday's close price. A decisive break below this would expose the next support level at $174.01, potentially accelerating the downward slide.
Momentum indicators confirm the weakness. The MACD is deep in negative territory, with the signal line showing no signs of slowing the drop. Although the Relative Strength Index (RSI) on the daily chart is approaching oversold territory at 36.11, it has not yet signaled a clear reversal. The hourly RSI paints an even bleaker picture at 27.53, reflecting intense short-term selling pressure. Meanwhile, the average true range (ATR) near $26 shows heightened volatility, meaning daily price swings of this magnitude are becoming routine. This environment demands careful risk management.
The stock's positioning near the lower Bollinger Band at $180.51 suggests exhaustion, but such conditions can persist during extended downtrends. Looking ahead, the Q2 earnings release represents a binary event that could swing sentiment sharply in either direction. Investors may want to monitor how BE’s next moves unfold in this volatile state, especially with technical landmarks so tight. The overall atmosphere remains grim, as bearish trends dominate and no clear technical relief is yet in sight.