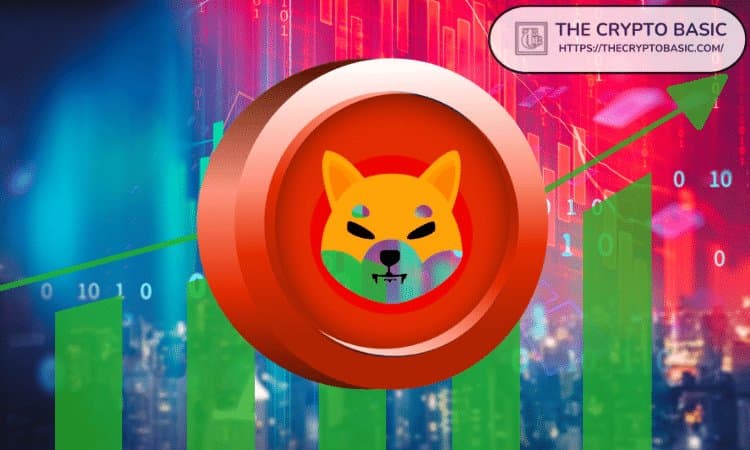
Shiba Inu is knocking on the door of its biggest resistance level in five years. The token sits near the descending trendline that has capped every meaningful bounce since it peaked at $0.00008854 back in October 2021. Currently at $0.00000498, SHIB has spent years beneath this ceiling. Now buyers are testing it again.
Analyst Eunice Wong laid out the weekly and daily charts showing the shape of things. What matters most: the token has built a long consolidation pattern around historic support levels. The prolonged bottoming structure suggests the market is finding its footing after years of lower highs and pushbacks. Every recovery attempt from 2021 onward failed to crack that descending line. This time feels different only because SHIB has spent enough time under pressure to potentially break through.
Recovery Off June Lows Gathering Steam
The bounce has real bones to it. SHIB bottomed near $0.00000405 in June, then rallied to $0.00000596 last week before pulling back briefly. Buyers stepped in again. The token has now recovered roughly 22% from its worst levels, and volume rose during the initial move higher, which typically signals fresh participation rather than thin wicks. That's the kind of detail that matters when testing a five-year barrier.
The daily chart shows improving momentum even though SHIB still trades below its long-term exponential moving average. That creates a built-in ceiling even if the descending trendline breaks. Wong stressed this won't be a quick moon shot. The breakout, if it happens, could take weeks or months to develop. The resistance has held since 2021. It won't crumble overnight.
Double-Bottom Signal and the Next Target
Another analyst, BuddyKing, spotted a potential double-bottom pattern forming. Buyers have consistently defended the $0.00000455 to $0.00000460 support zone while the token tests resistance around $0.00000485 to $0.00000490. If that neckline gives way, the pattern could target $0.00000520. It's not a guarantee. Patterns fail. But the convergence of support holding and two independent technical views pointing the same direction adds weight to the case.
The bigger picture remains unchanged though. SHIB has spent years in a bear trend. One solid bounce off June lows doesn't erase that. What it does is shift the conversation from "endless decline" to "maybe something is building here." For traders watching the token, the next real test is whether buyers can keep SHIB above $0.00000490 through the coming days. Break that and the descending trendline becomes the real prize. Hold it, and the bounce dies quietly like the last five attempts.
This analysis is informational only and should not be construed as investment advice. Crypto markets remain highly volatile and breakouts often fail. Do your own research.