Alibaba stock jumped 9% intraday after the company rolled out Qwen 3.8-Max, a 2.4 trillion-parameter AI model that sets the company apart in the competitive generative AI race. The move was sharp and aggressive, but the technical setup tells a more cautious story underneath.
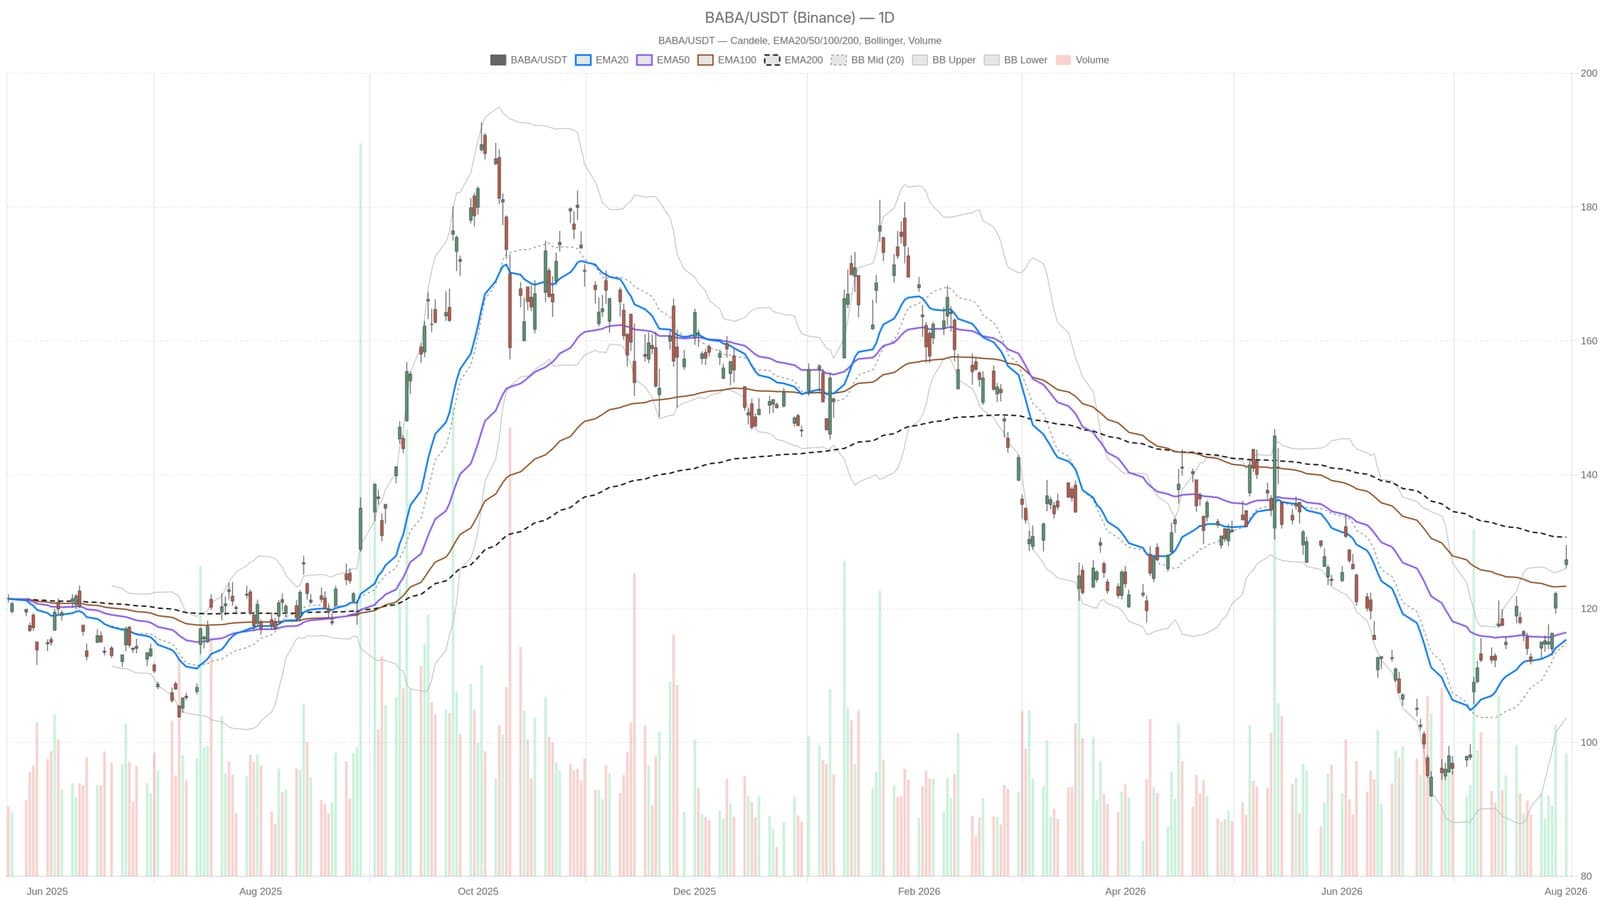
BABA closed at 127.30, sitting above both the 20-day and 50-day moving averages at 115.38 and 116.45 respectively. That signals recent upside momentum is real. But there's a catch: the stock remains below the 200-day average at 130.70, which means the longer-term trend structure hasn't actually flipped bullish yet. The regime on the daily chart stays neutral.
The hourly timeframe is running hot. RSI14 there sits at 76.96, deeply overbought. On the daily, RSI14 hit 69.41, brushing against overbought territory but not yet extreme. MACD is constructive with the histogram at 1.37, confirming active upside momentum for now.
The Bollinger Band Breakout Carries Mean-Reversion Risk
Alibaba closed above the upper Bollinger Band at 126.05, which typically signals a genuine breakout attempt after a strong catalyst like an AI announcement. The problem: breaking above the band this sharply also raises the odds of a near-term pullback toward the band itself. Daily ATR14 stands at 4.23, showing volatility has expanded materially following the news.
Price action is caught between two competing forces. Momentum is stretched on shorter timeframes, and the hourly setup is outright bullish. But the daily trend remains incomplete as long as price can't clear the 200-day EMA at 130.70. That's the key structural line that would confirm a genuine shift in regime.
The immediate pivot point sits at 127.61. Resistance above sits at 129.19. A close back below the upper Bollinger Band would suggest mean-reversion is underway.
This is informational analysis, not investment advice. Always do your own research before making trading decisions.