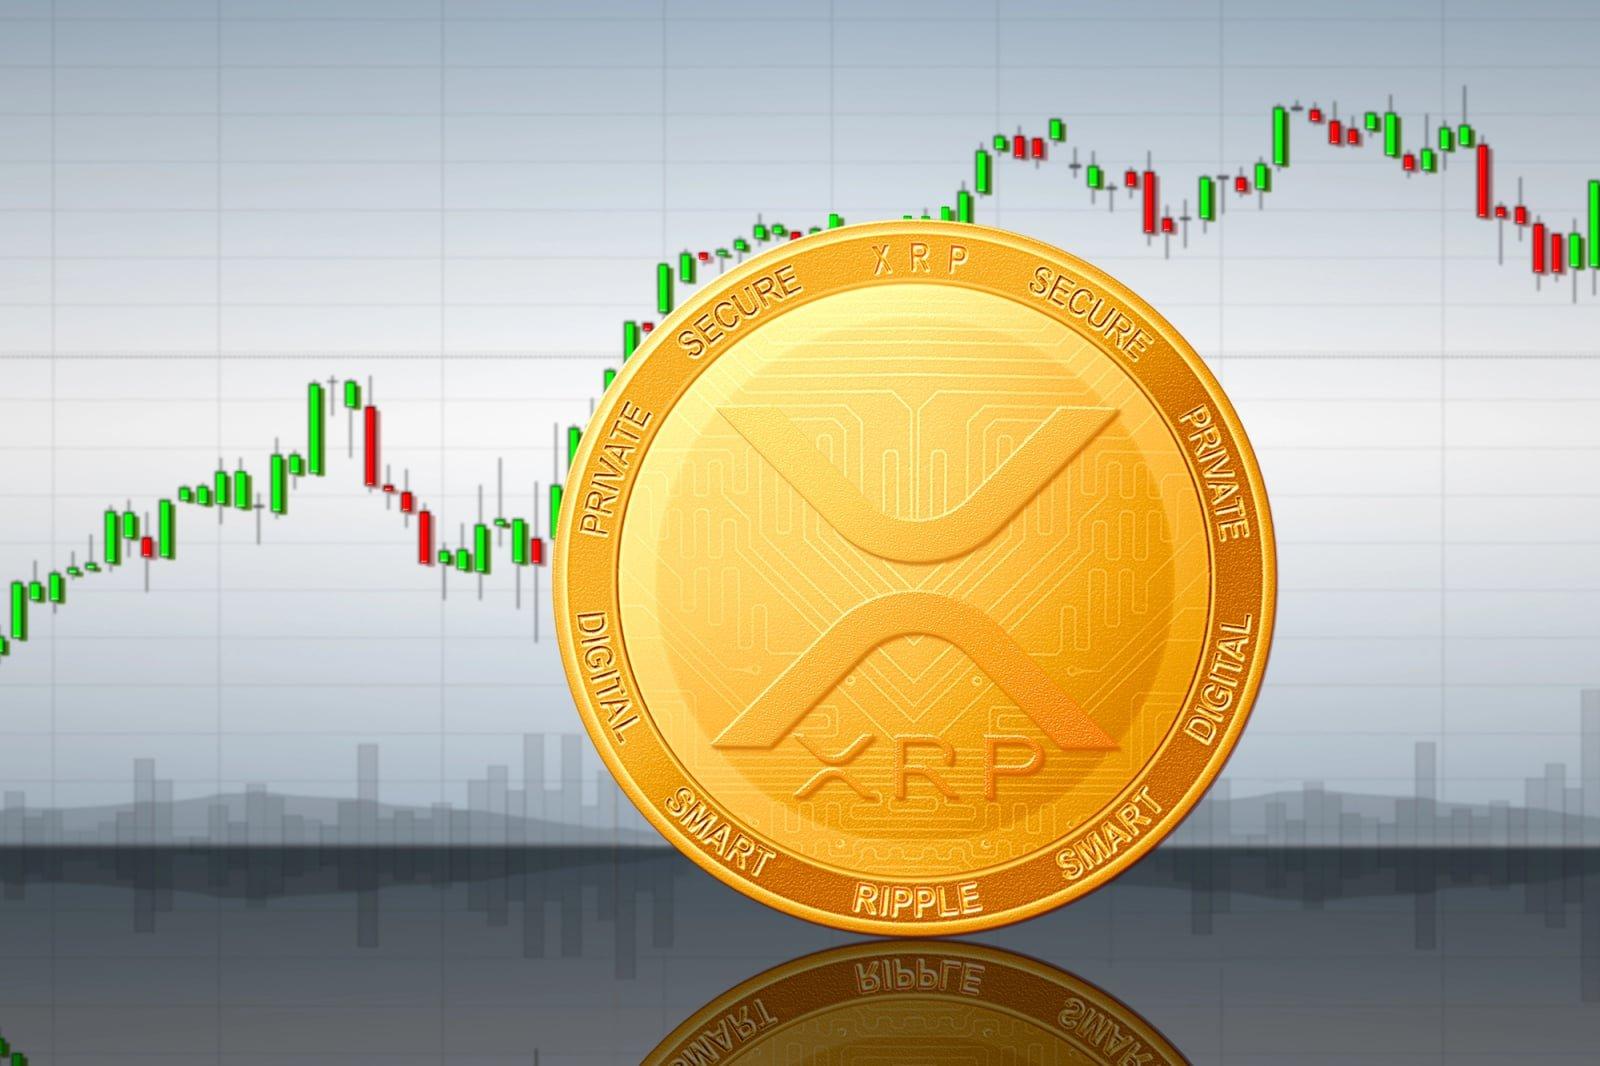
XRP is currently testing critical support levels around $1.10, yet recent data from Bollinger Bands indicate a potential for the price to reach $2. This follows significant volatility, with XRP’s price having previously soared above $3 earlier in 2026.
Market Dynamics and Technical Indicators
The current week has proven challenging for XRP holders as the token's price dipped to $1.1018, nearing the lower Bollinger Band at $1.0562. This momentary decline presents a crucial phase for the asset, determining its price trajectory for the latter half of the year.
Despite the ongoing pressures, technical indicators suggest that the target of $2 is not an unrealistic expectation. The asset is showing signs of an oversold market, given that the weekly RSI dropped to 33.78, indicating that the possibility of further declines is limited without a rebound.
Support Levels Holding Firm
As observed on the monthly chart, there is a steady foundation with buyers defending the midline of the Bollinger Bands, particularly at the 20-period SMA, priced at $1.1039. This support level remains intact, suggesting that the bullish trend persists. Additionally, with the RSI close to 41.87, there is ample room for upward movement.
The data aligns with trends seen in other sectors, such as institutional investments. XRP ETFs have witnessed inflows for nine straight weeks, increasing total assets under management to $1.49 billion, indicating a shift in investment focus away from retail traders locking in losses.
The information presented in this article is for informational purposes and should not be considered as financial advice.