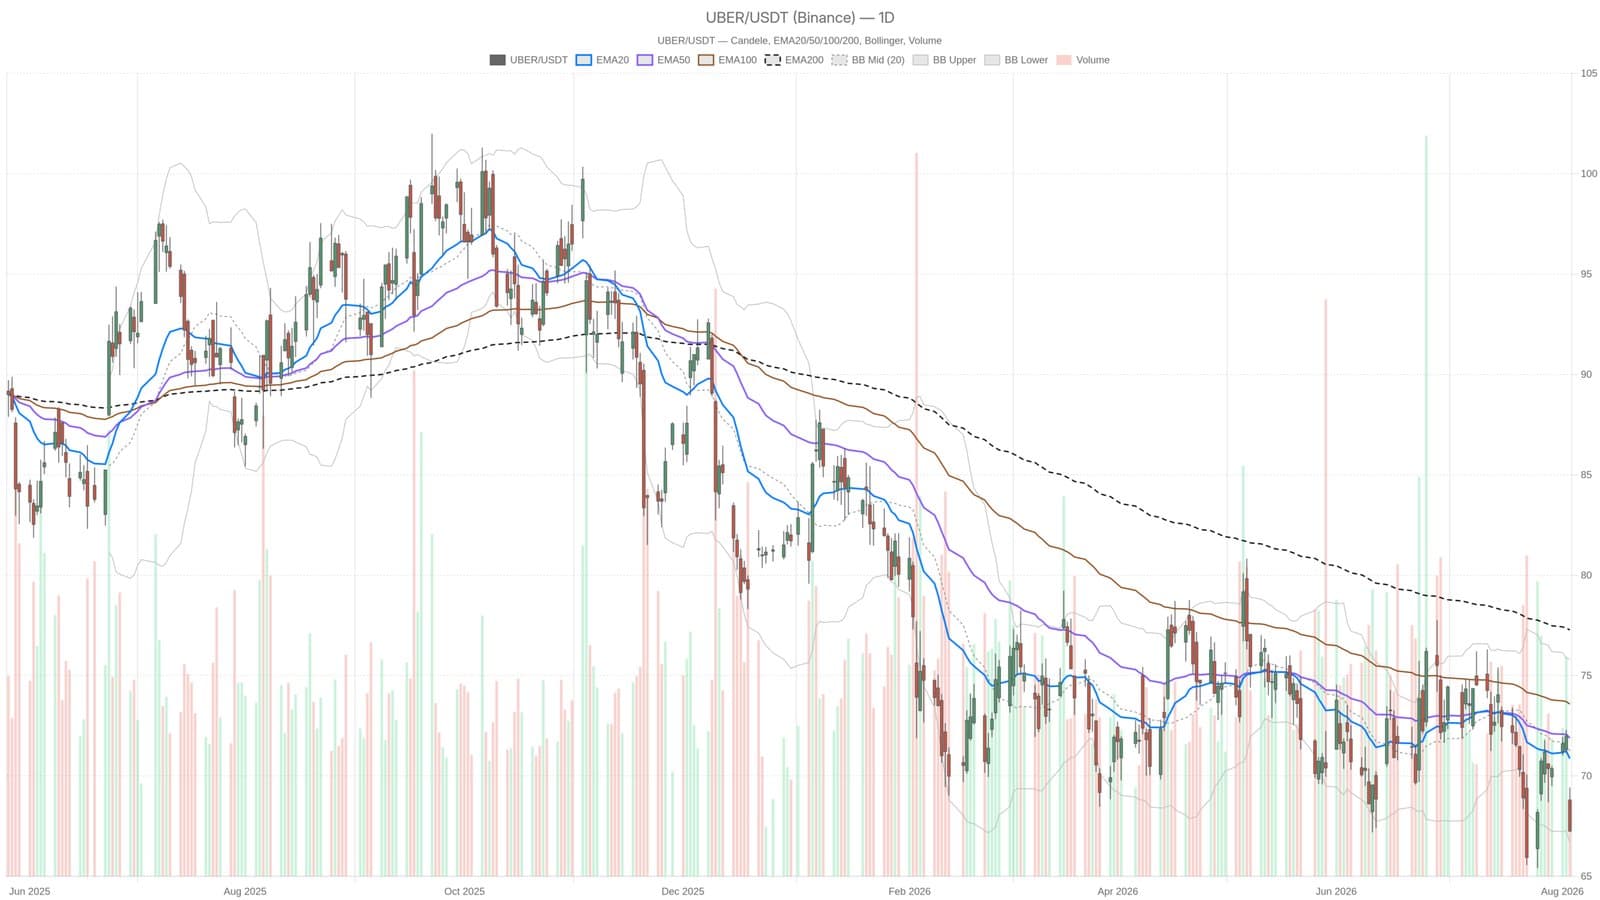
Uber stock dropped to $67.25 on August 5, sliding from a $68.80 open after the company's Q3 forecast spooked investors. The earnings surprise itself looked solid. Bookings and profit both beat expectations. But weak guidance for the next quarter flipped the mood instantly.
The selloff sent technicals firmly into bearish territory. Price now trades below the EMA20 at 70.86, the EMA50 at 71.89, and the EMA200 at 77.27. That stacked moving average alignment is what traders call textbook bearish structure. All three are descending and act as resistance overhead.
Momentum Fades but Sellers Still Have Room
The daily RSI14 sits at 39.82, weak but not yet oversold. The MACD histogram sits negative at -0.11, with the line below signal, confirming downside momentum is still building rather than exhausted. Volatility spiked. The ATR14 jumped to 2.38, a meaningfully elevated reading that reflects the size of the earnings-driven repricing.
Price is now hugging the lower Bollinger Band at 66.67 while the midline sits at 71.25 and the upper band at 75.83. That means the stock is stretched to the downside relative to recent ranges. A break below daily support at 66.52 opens the door toward the lower Bollinger Band and potentially further losses. On the hourly chart, RSI14 has crashed to 26.14, deep oversold territory that raises odds of a short-term bounce. But that relief, if it comes, would only be a pullback inside a larger downtrend.
The bearish scenario holds as long as price stays below the EMA20 and EMA50 cluster at 70.86 to 71.89. A clean close above that zone would be needed to signal any meaningful shift in regime. Until then, sellers control the tape.
This analysis is for informational purposes only and does not constitute financial advice or investment recommendation.