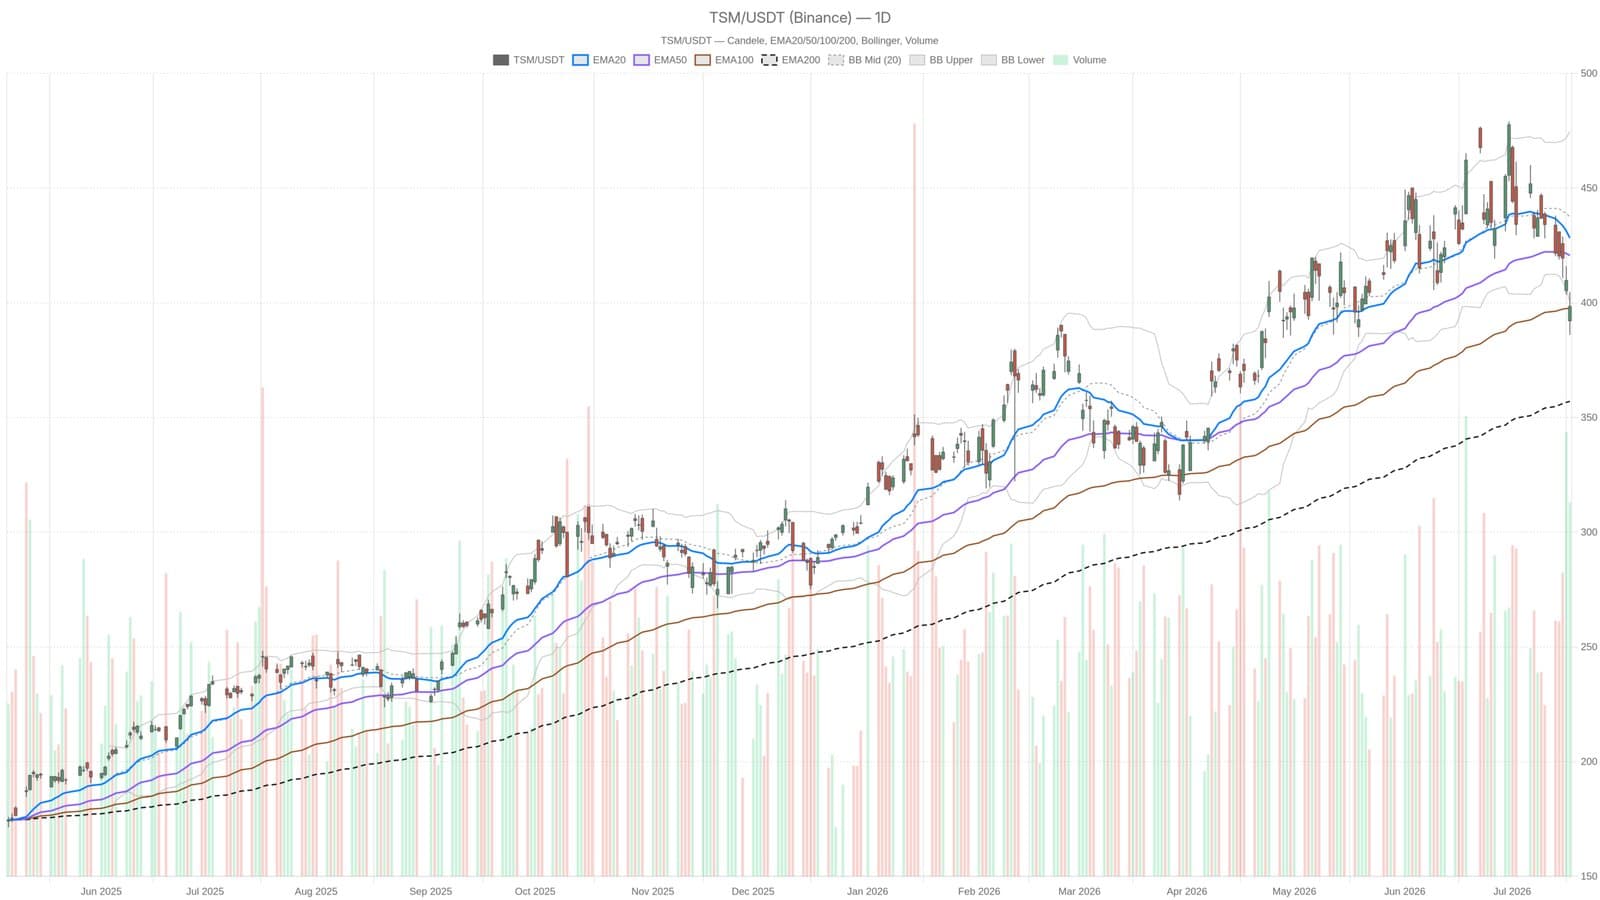
TSMC shares declined to $398.37 on July 20, trading below critical technical averages despite the company’s $265 billion commitment to U.S. AI-related investments. The stock faces persistent bearish momentum amid strong fundamental growth fueled by rising AI demand.
Technical Indicators Signal Downtrend
The stock closed significantly under its 20-day EMA at $428.20 and 50-day EMA at $420.60. It is near the lower Bollinger Band at $400.10, indicating continued selling pressure rather than consolidation. The daily RSI stands at 39.11, close to oversold levels without any bullish reversal signals. The MACD reflects accelerating bearish momentum with its line at -4.21 and signal at 1.59, supporting a downtrend.
Support is noted at $388.03, with a break likely opening a path toward the 200-day EMA near $357.01, which remains a longer-term support level. The daily average true range of $20.64 suggests that volatility remains within a normal range despite the decline.
On the hourly chart, the bearish picture deepens as price trades below the EMA20 ($407.25), EMA50 ($418.36), and EMA200 ($429.64). Hourly RSI at 33.52 nears oversold territory, but this has yet to trigger a rebound.
TSMC’s solid Q2 results and the acceleration of AI-driven demand present a contrast to the technical weaknesses in the stock’s price action. The company’s substantial investment bet underlines strong confidence in AI growth trends, but market sentiment currently favors selling.