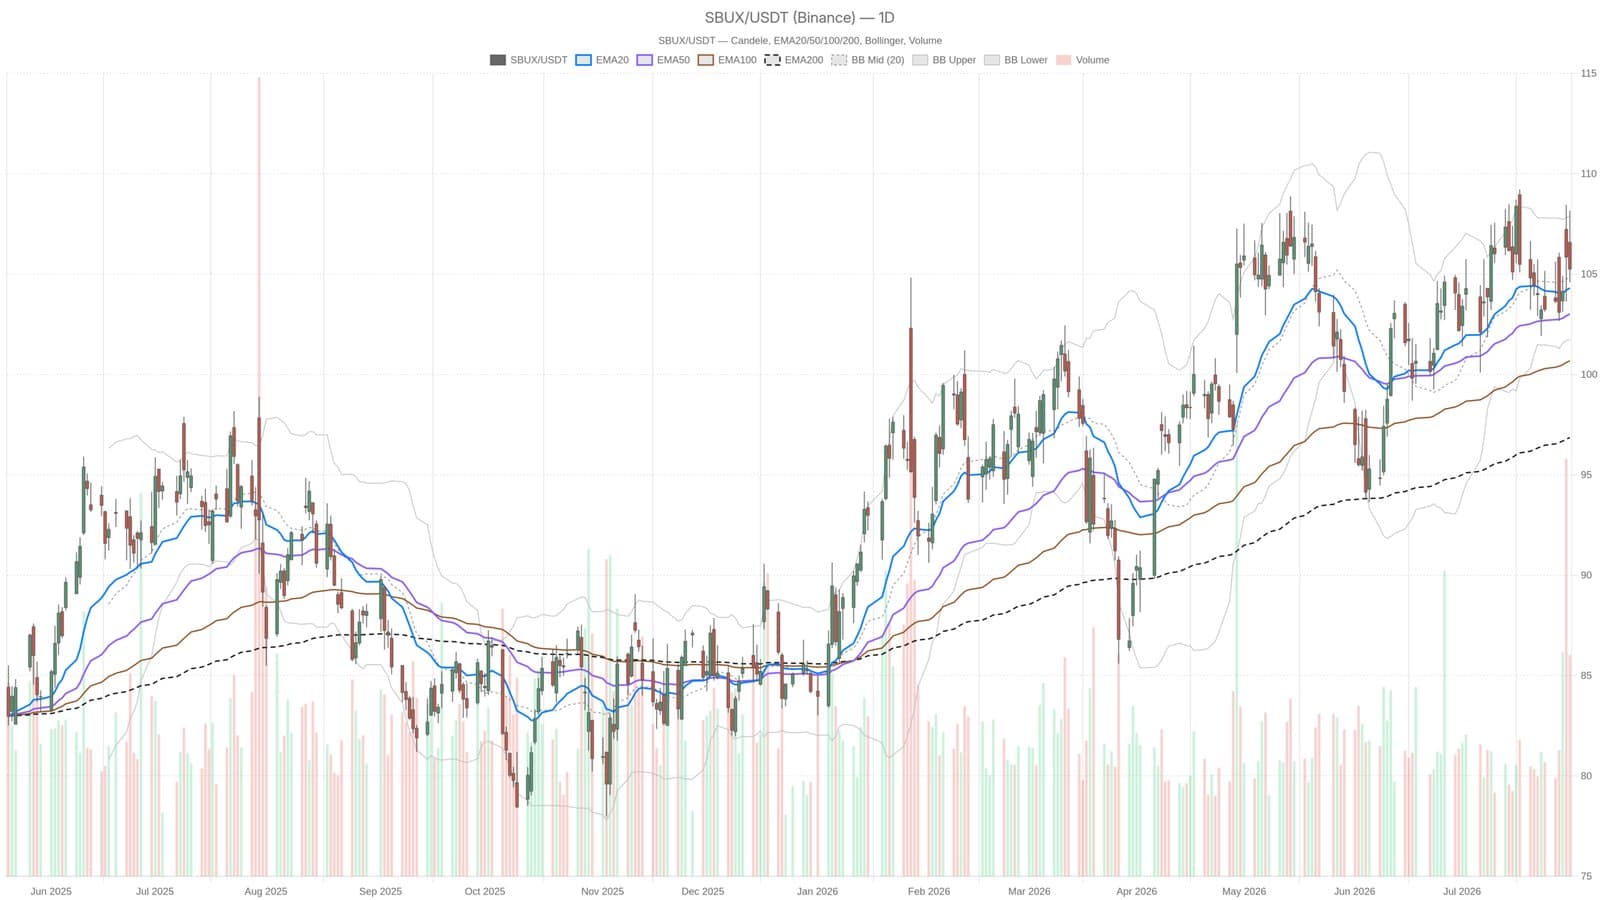
Starbucks shares fell from a peak of $108.16 on July 31 to close at $105.25, signaling resistance near that high and a test of support around $104. This retreat comes despite the stock maintaining a bullish stance with all major exponential moving averages 20, 50, and 200-day still sloping upward. The 20-day EMA stands at 104.30, acting as a key short-term support line.
While the price action hints at strength, internal momentum indicators tell a more cautious story. The MACD shows a negative histogram reading of -0.13, indicating momentum is waning even as the overall trend remains upward. The RSI confirms moderate strength at 54.39, far from overbought but lacking conviction. Bollinger Bands reveal that after pushing towards the upper band near 107.87, the stock has pulled back closer to the middle band at around 104.81, suggesting the recent advance may need to consolidate.
The support zone between $103.84 and $104.30 represents the critical line for bulls to hold. If the stock regains momentum, reclaiming $106 and moving above $107.41 could re-ignite buying interest. For now, investors watch as the trend continues higher but momentum cools, highlighting a fragile tug of war between buyers and sellers.
This material serves informational purposes and does not constitute financial advice.