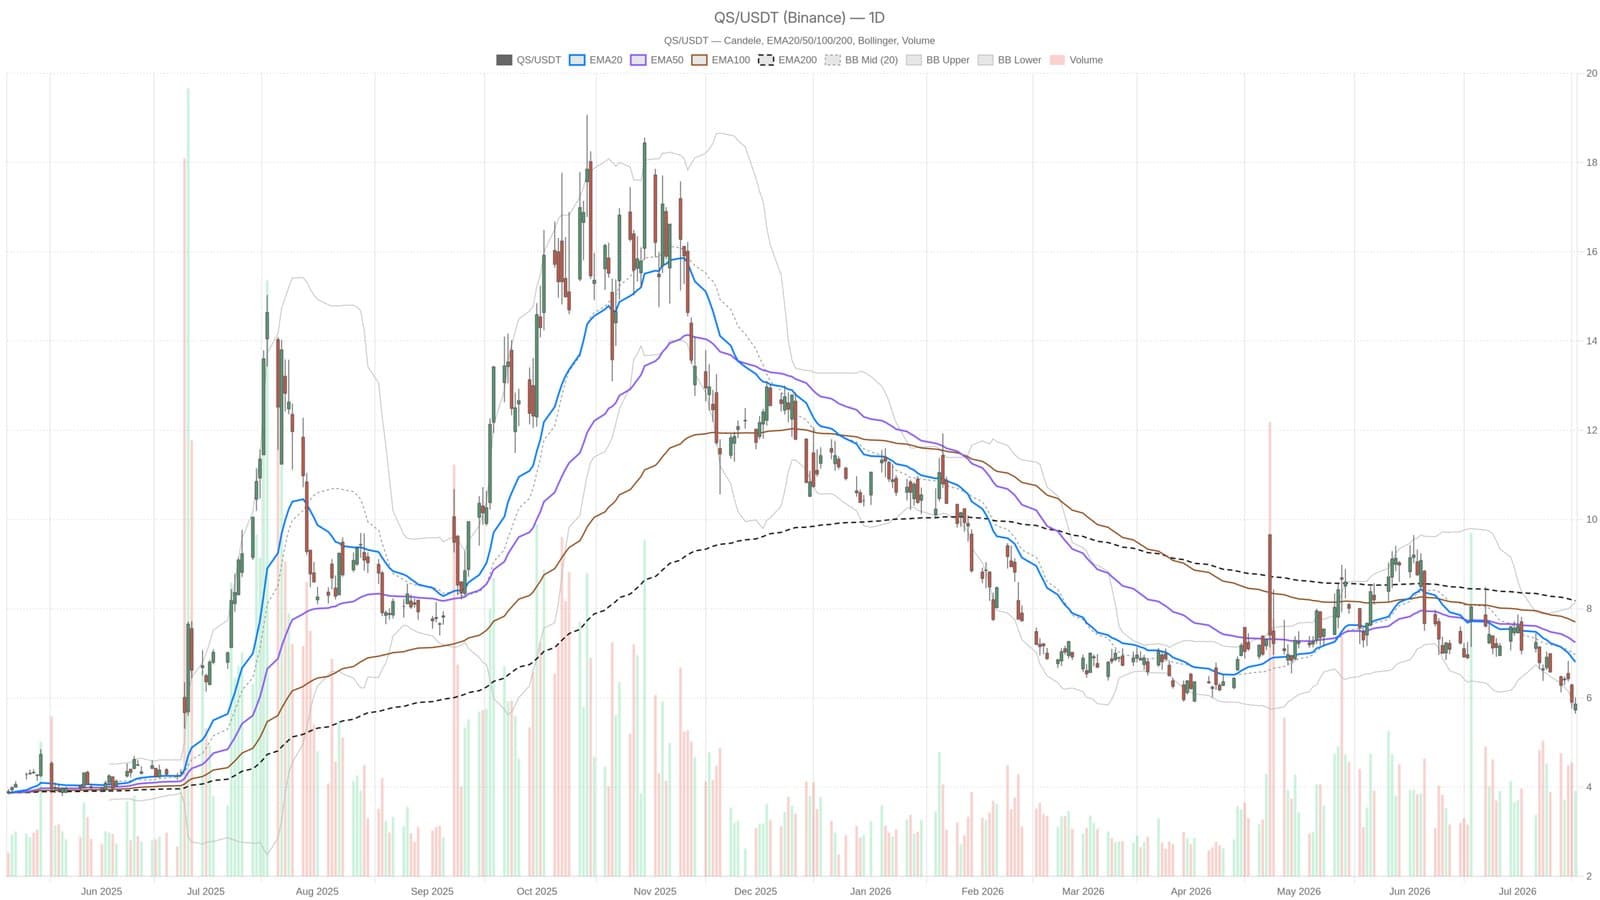
QuantumScape shares closed at $5.86 on July 17, trading below all key daily exponential moving averages (EMAs) and signaling a strong bearish technical stance. The stock would require a 16% increase to surpass the EMA20 level at $6.81, a threshold necessary to confirm a bullish reversal.
Technical Indicators Demonstrate Persistent Downtrend
QuantumScape’s price remains significantly under the EMA20 ($6.81), EMA50 ($7.24), and EMA200 ($8.18), with all three averages trending downward, confirming a sustained decline rather than a brief pullback. The daily Relative Strength Index (RSI) registered 33.57, approaching oversold conditions but has yet to provide a clear reversal signal. The Moving Average Convergence Divergence (MACD) indicator continues to be negative across daily and hourly charts, with values at -0.41 versus a signal line at -0.31, reinforcing the bearish momentum.
The Bollinger Bands tighten pressure on the price, as the lower band lies at $5.80, just below the closing price, indicating ongoing selling pressure rather than a temporary dip. Average True Range (ATR) stands at $0.47, suggesting sizable intraday volatility remains, necessitating cautious risk management for short-term traders.
Pivot Levels and Market Direction Unclear
The daily pivot point at $5.84 almost matches the closing price, indicating indecision within the trading session. Resistance level R1 is at $6.03, near the session high of $6.01, while support S1 is located at $5.67. Given the broader downtrend, moves toward the $5.67 support bear more significance than attempts to break above resistance.
QuantumScape approaches Q2 earnings with projections of wider losses and limited revenue visibility amid ongoing pilot-line spending. This fundamental uncertainty adds to the fragile outlook and weighs on investor sentiment.