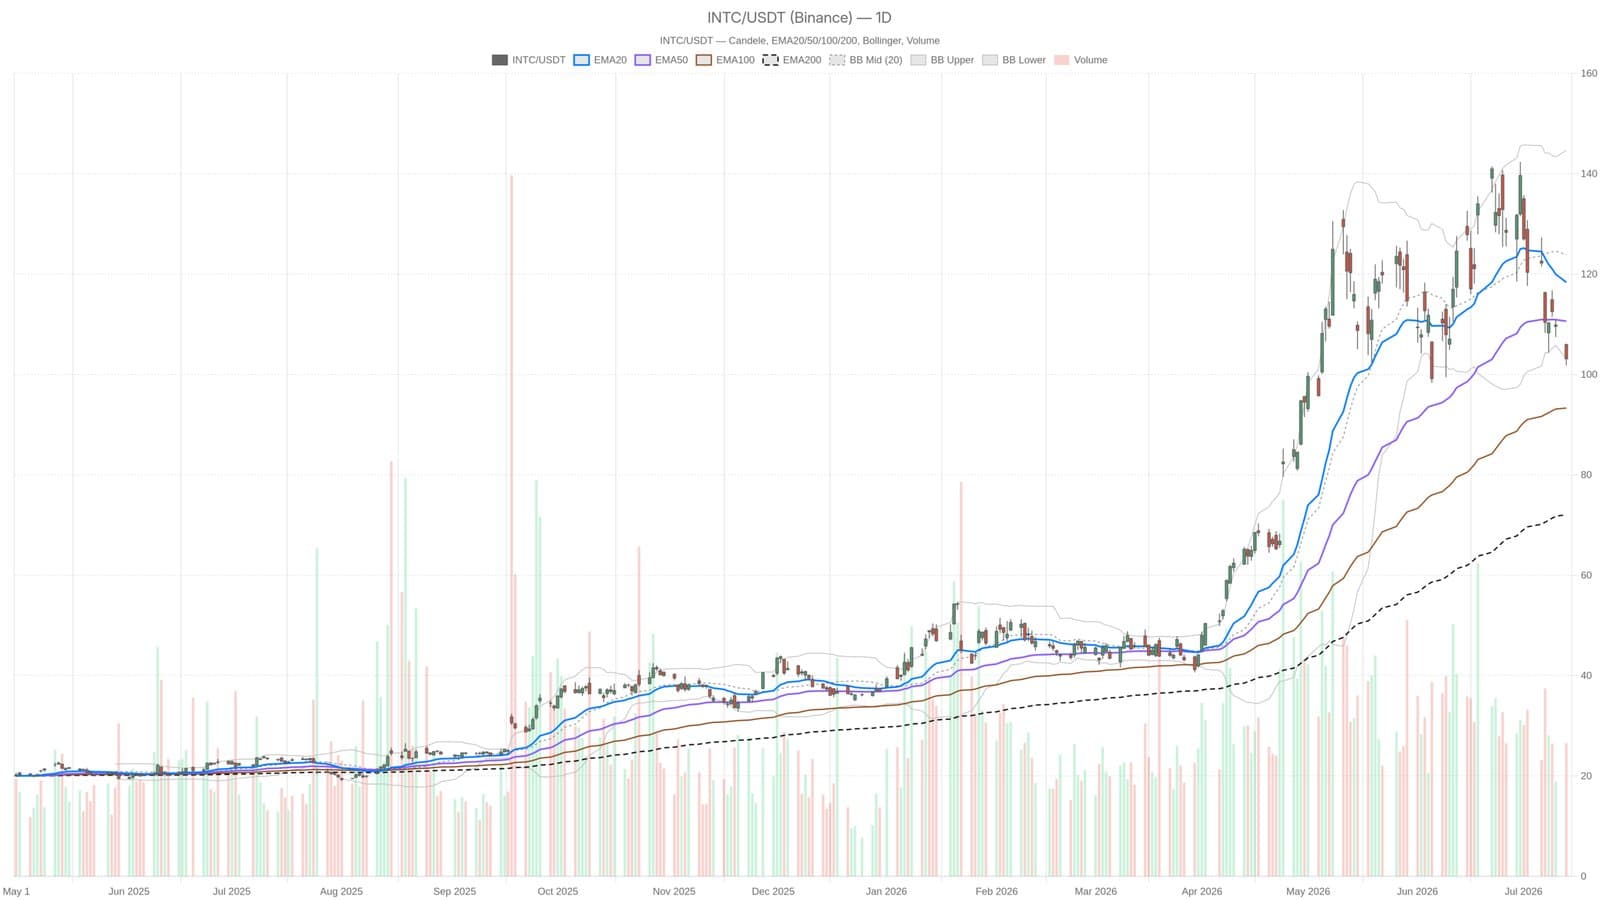
Intel's stock fell to $103.12 on July 13, reflecting significant bearish momentum as the company navigates a critical juncture. With the share price sitting below both the 20-day and 50-day exponential moving averages (EMAs), traders are left questioning the stability of the stock.
Current Market Indicators
Key technical indicators reveal a troubling landscape for Intel investors. The daily MACD histogram sits at -3.64, suggesting that the bearish momentum is intensifying. Furthermore, hourly indicators confirm the downward trend, with the stock trading below all three critical moving averages, indicating a distribution rather than accumulation pattern.
The recent $5.7 billion investment in artificial intelligence has raised concerns among analysts regarding profit margins and potential risks ahead of the forthcoming earnings report. As a result, the stock is now positioned at a statistically oversold extreme, closing at the lower Bollinger Band for the day. The midline of the Bollinger Bands stands at $123.88, revealing a significant gap from current trading levels.
Market sentiment remains cautious, as the daily Relative Strength Index (RSI) is at 39.4, nearing oversold territory but not yet signaling a reversal. The absence of bullish catalysts exacerbates the situation, leaving investors in a precarious position. The daily pivot point is set at $103.69, with Intel closing just below this threshold, which could indicate further declines if the stock fails to reclaim higher levels.
As traders continue to monitor the stock, the burden of proof falls on bullish investors to demonstrate strength by pushing the price back above the 50-day EMA at $110.61. Until such a recovery occurs, bearish sentiment is likely to dominate.
This material is informational and should not be considered financial advice.