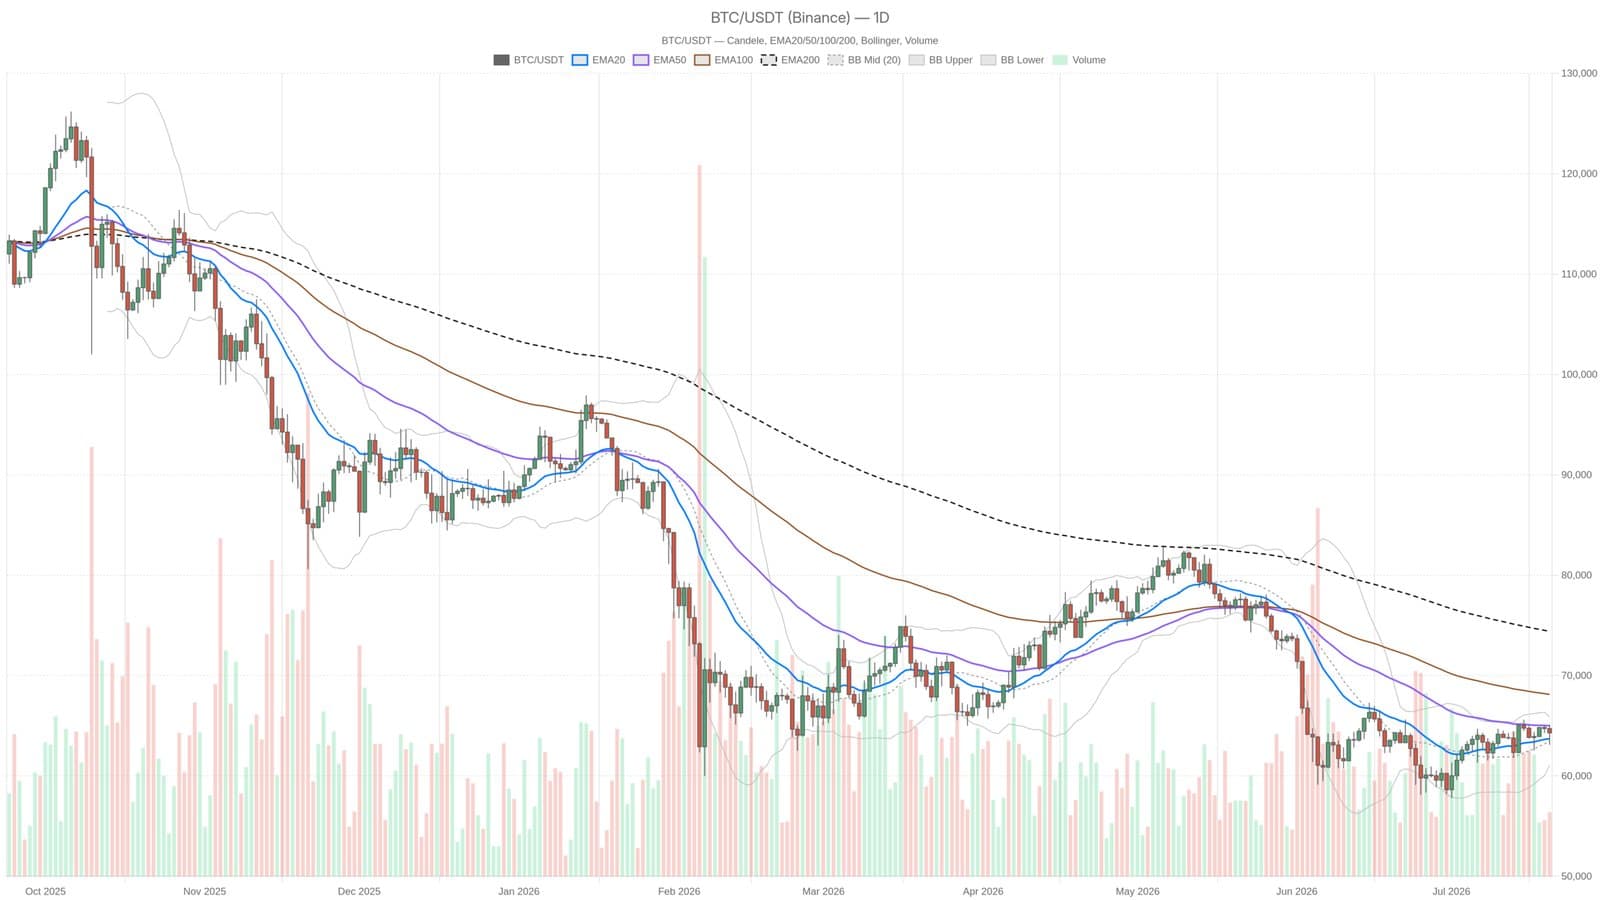
On July 20, 2026, Bitcoin traded around $64,290, confined within a narrow range amid conflicting market signals. The price remains pressured by a damaged macro structure but shows early signs of short-term momentum recovery.
Market Indicators and Price Action
The Fear & Greed Index has fallen to 29, reflecting cautious sentiment across the crypto space. Bitcoin dominance stands at 56.4%, indicating that capital is not shifting into alternative coins. The price closed slightly above the 20-day Exponential Moving Average (EMA20) at $63,705 but still trades below the 50-day EMA at $65,003. The 200-day EMA, positioned at $74,405, highlights the distance from long-term average levels and the ongoing recovery phase.
Technical indicators on the daily chart suggest easing selling pressure. The MACD line crossed into positive territory at +253.23, with a histogram of +267.79, signaling a potential momentum shift, although not a confirmed bull run. The Relative Strength Index (RSI) sits at 52.52, just above neutral levels.
Bollinger Bands remain compressed with the midline at $63,469, upper band at $65,869, and lower band at $61,069. The Average True Range (ATR) is $1,576, suggesting that volatility has yet to expand significantly. Bitcoin's price is positioned slightly above the daily pivot point of $64,166 but below the first resistance level at $65,231, putting it in a zone with no clear directional bias.
On the hourly timeframe, bearish pressure persists despite the daily bullish signals, indicating mixed short-term dynamics.
Institutional demand continues supporting Bitcoin with a reserve of $3 billion accumulated, which acts as a buying floor amid market uncertainty.
Information provided is for informational purposes only and does not constitute financial advice.