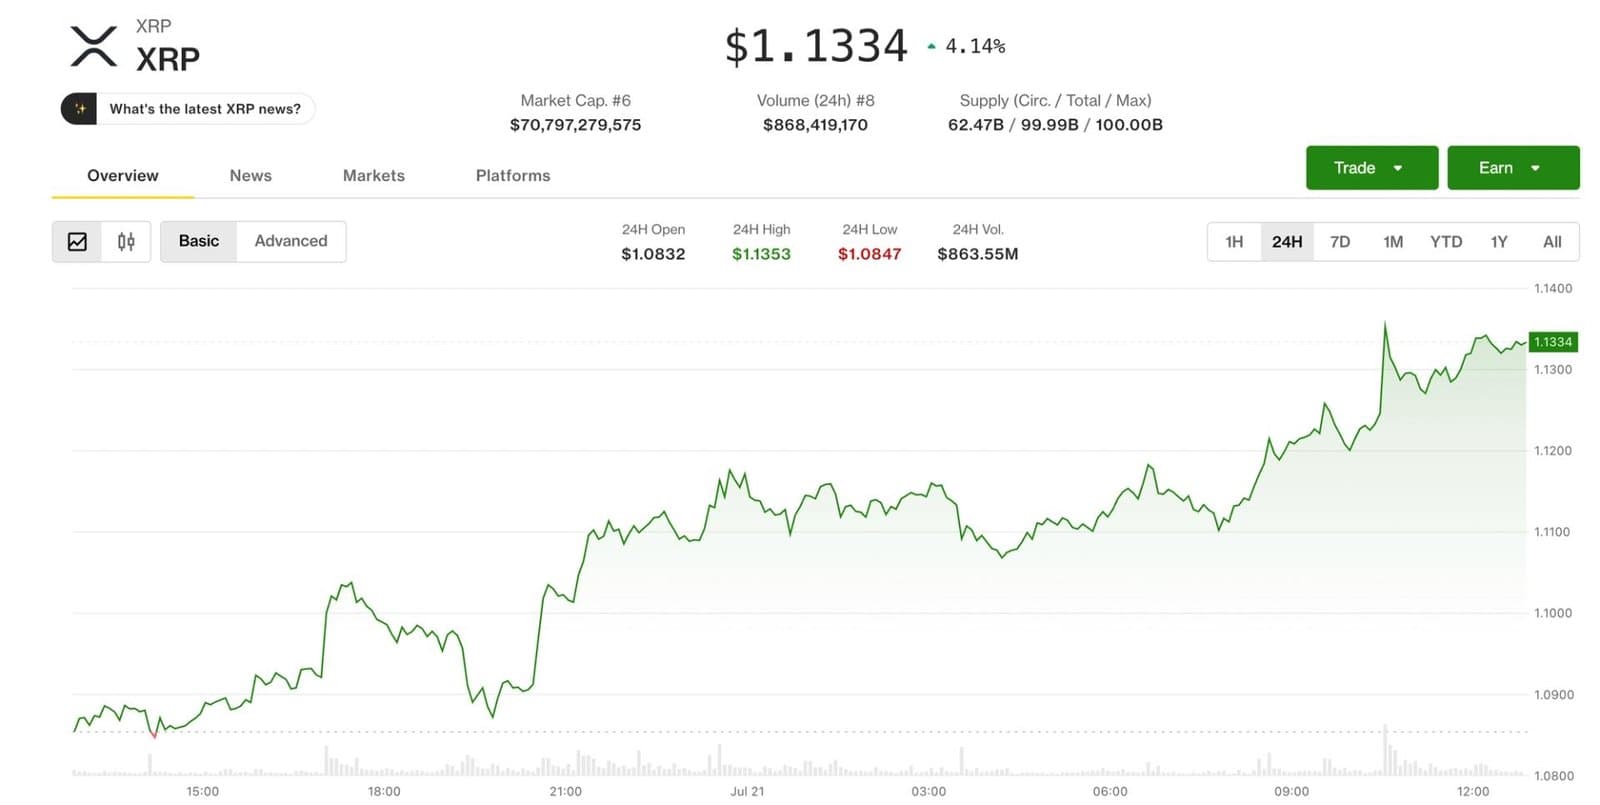
XRP surged about 4.6% within 24 hours, reaching around $1.13 as traders monitor a potential breakout from a short-term symmetrical triangle pattern. This price level is critical to confirm momentum toward a target near $1.35.
Price Movement and Market Data
The cryptocurrency opened near $1.0925 and climbed past $1.10 before approaching $1.13, following a period of sideways trading between $1.09 and $1.11. Trading volume rose during this move, with a 24-hour volume of approximately $1.27 billion and a market capitalization close to $70.85 billion, according to CoinGecko.
Technical Analysis and Resistance Levels
Analysts point to $1.13 as a key short-term resistance. A sustained break above this level could trigger a rally toward $1.35. The hourly chart depicts XRP compressing within a symmetrical triangle, characterized by lower highs and higher lows, suggesting consolidation before a potential breakout.
However, the daily chart presents a more cautious outlook. XRP remains within a descending channel that has capped gains for several months, with the 100-day and 200-day moving averages positioned above the current price and trending downward. The broader resistance zone lies between $1.24 and $1.28, which must be surpassed to signal a stronger reversal.
Support and Risks
On the downside, the support area ranges from $1.02 to $1.06. Should XRP fall below this band, it could expose lower levels in the $0.88 to $0.92 range. The current price action reflects an attempt to turn short-term support into upward momentum.
Analyst Ali Martinez noted on X that the monthly chart shows a TD Sequential buy signal, reinforcing the bullish outlook if a breakout confirms. The token’s price action in the next sessions will likely determine if the rally toward $1.35 materializes or if downward pressure resumes.
Material is for informational purposes only and not financial advice