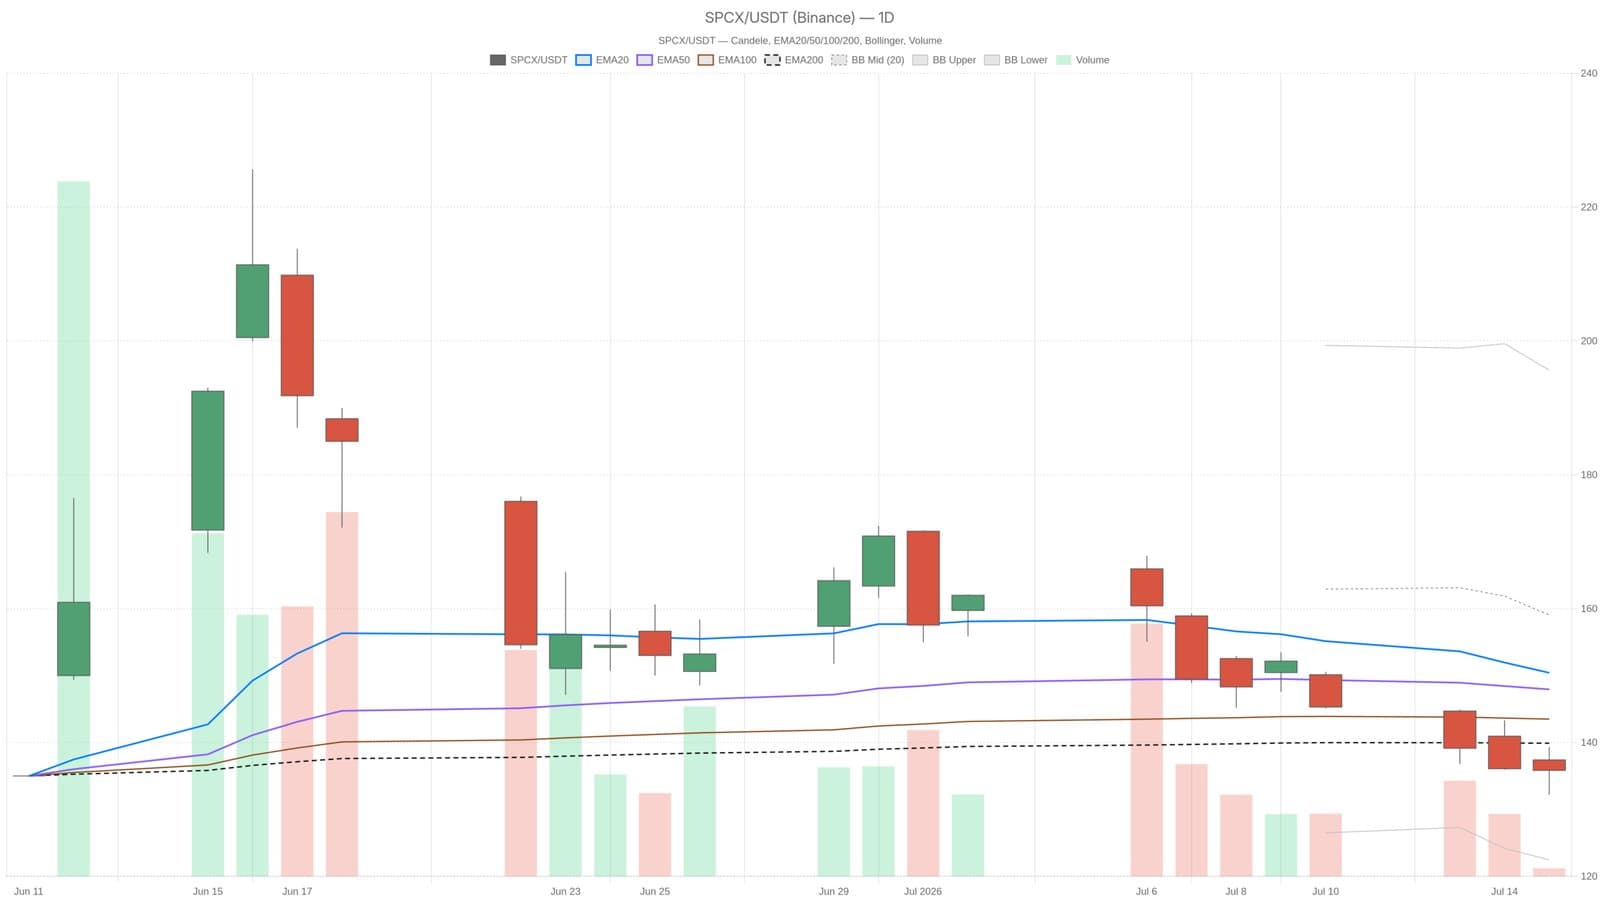
Space Exploration Technologies (SPCX) is experiencing significant challenges as its stock price dropped 35% from its peak, closing at $135.82 on July 15. This decline raises concerns about potential further losses as critical support levels are tested.
The stock has fallen nearly 9.7% in just the past month, and current trading positions below key moving averages indicate bearish momentum. The daily relative strength index (RSI) is sitting at 48.52, offering no clear signal of recovery or capitulation.
Momentum Indicators and Technical Analysis
Daily analysis reveals that SPCX is trading below key averages: the EMA20 is at $150.41, EMA50 at $147.94, and EMA200 at $139.89. This bearish trend reflects sustained selling pressure that has eliminated speculative buying interest. The MACD readings confirm this trend, with a histogram at -3.81 suggesting deepening negative momentum.
In addition to the volume patterns, Bollinger Bands indicate volatility context. The midline stands at $159.05, while the lower band is positioned at $122.46. The current price proximity to this lower band suggests that the decline has been substantial, although it has yet to reach extreme oversold territory.
Pivot point analysis further illustrates the precarious balance in SPCX’s current trading. The pivot point is at $135.78, nearly matching its closing price, with resistance levels set at $139.37 and support levels at $132.24. If the price breaks below $132.24, it could lead to testing the Bollinger lower band near $122.46.
The immediate outlook appears unfavorable, as the hourly chart continues to reinforce bearish sentiment. Current trading at $135.81 remains beneath EMA indicators at $139.15, $145.07, and $157.53. As SPCX navigates this turbulent period, market participants are closely monitoring key levels that will dictate the stock's trajectory.
This material is for informational purposes only and is not financial advice.