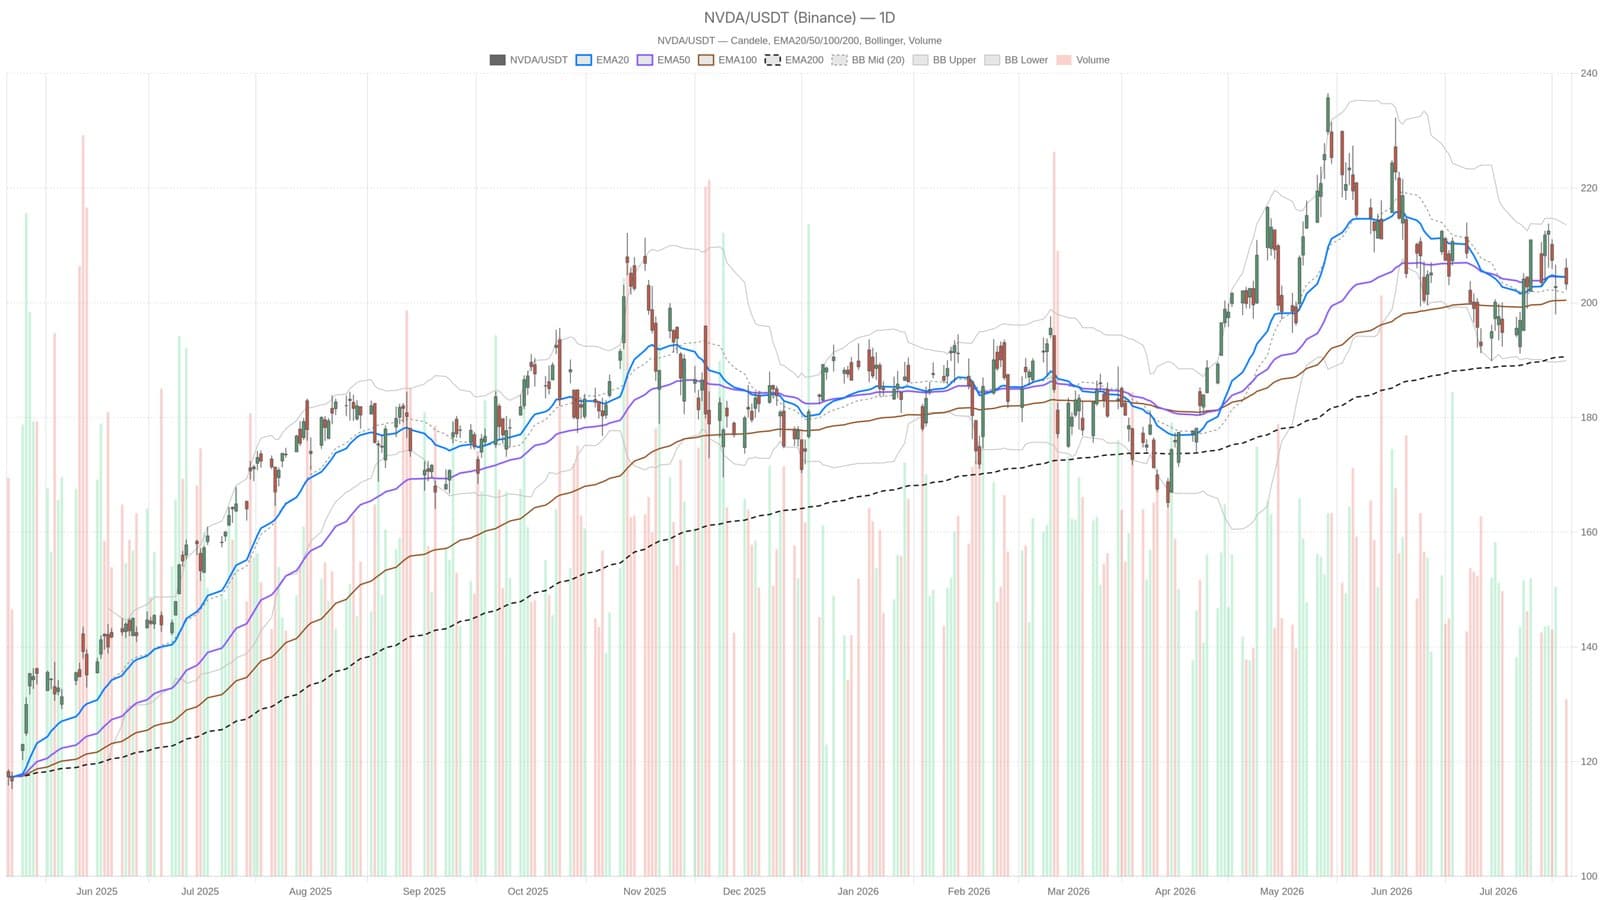
Nvidia shares closed at $203.28 on July 20, trading near a 26 percent discount to its estimated fair value despite recent flat price action. The stock remains caught between neutral daily indicators and bearish intraday momentum, creating uncertainty in its short-term direction.
Technical and Fundamental Analysis
On the daily chart, Nvidia’s price sits marginally below its pivot point of $204.43 and the overlapping EMA20 and EMA50 averages near $204.49. This alignment signals a lack of clear upward or downward momentum, with the daily RSI at 48.62 reflecting an equilibrium between buying and selling pressure. The EMA200 at $190.59 remains well below current levels, confirming the long-term uptrend has not been broken.
Intraday charts paint a different picture. Both the 1-hour and 15-minute timeframes show bearish regimes, with the price below all key hourly EMAs clustered around $205.30. This divergence between daily neutrality and hourly weakness complicates the outlook.
Additional indicators provide nuanced insights. The MACD line stands just below zero, suggesting selling pressure is beginning to ease but has not reversed. Bollinger Bands place the upper resistance at $213.60 and a support band near $189.91, close to the EMA200, indicating a double support zone if prices fall sharply.
The daily average true range (ATR) of $7.28 indicates moderate volatility, with intraday price swings remaining within typical bounds. A close above $204.49 could shift the short-term trend to bullish, targeting the noted resistance level.
According to analysis, Nvidia’s fundamental strength, particularly driven by surging AI revenue, contrasts with its range-bound share price since November. This disconnect contributes to the current technical stalemate. Market participants appear cautious amid these conflicting signals, weighing long-term growth potential against near-term selling pressure.
This article is for information only and is not investment advice.