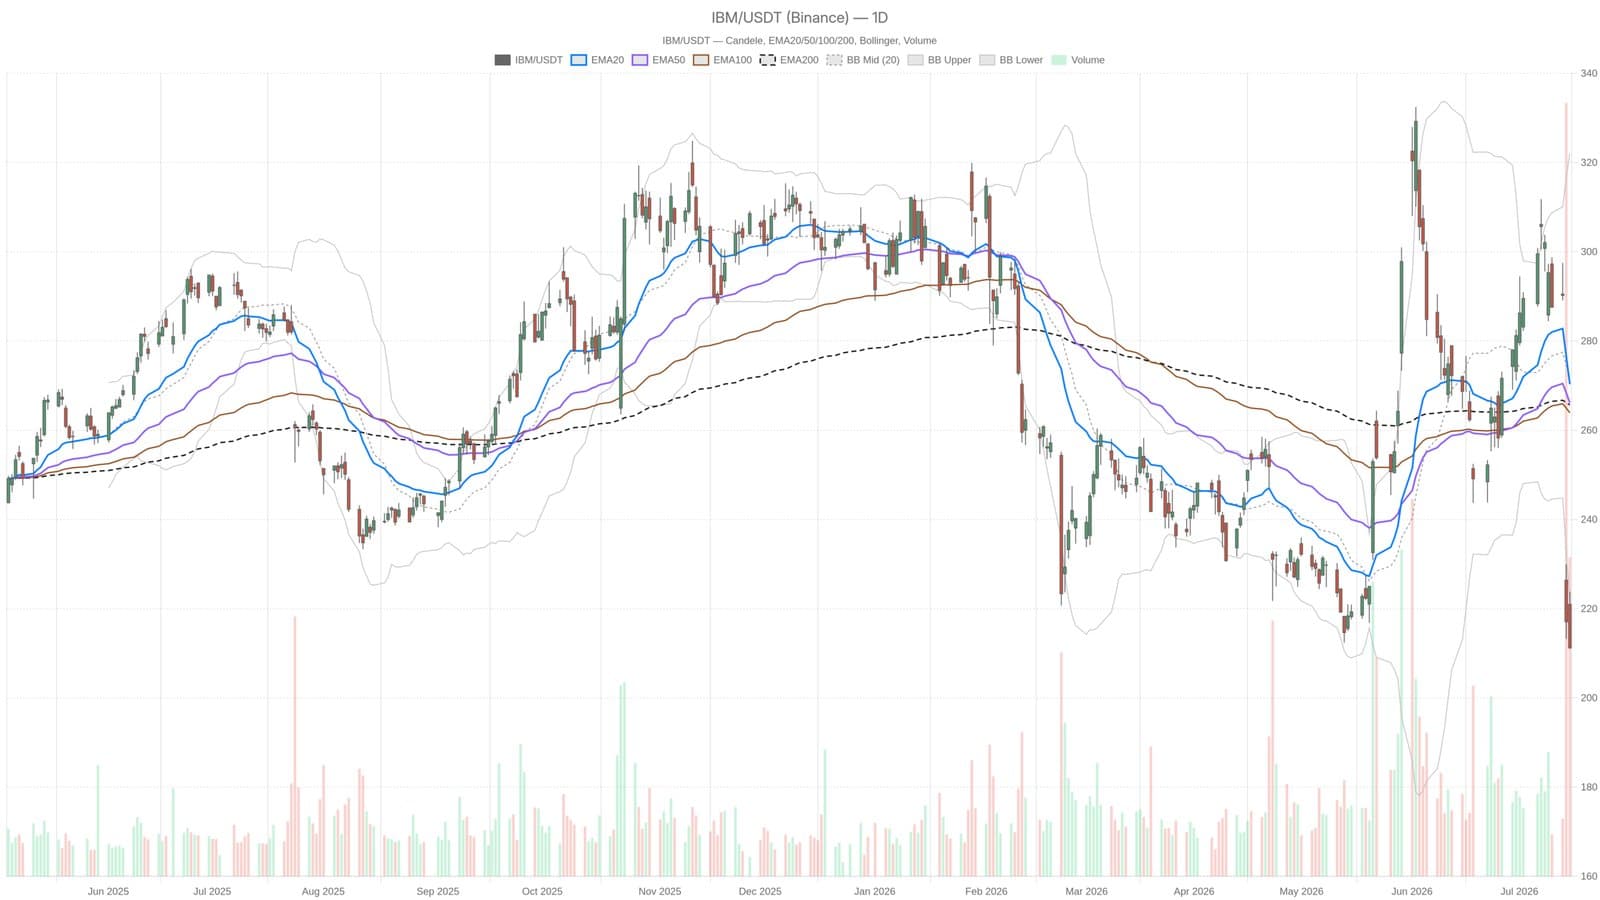
IBM's stock price dropped significantly after the company issued a profit warning, closing at $211.20 on July 15. This sharp decline triggered a wave of selling, with approximately 27.8 million shares exchanged during the trading session.
Technical indicators reveal that IBM is currently in a bearish position. The daily Relative Strength Index (RSI) stands at 29.17, just above the oversold threshold, while the MACD histogram has plummeted to -7.75. These metrics confirm that the stock is experiencing substantial selling pressure.
Market Conditions
The stock's performance shows it trading about $55 below its nearest exponential moving averages, which are now acting as a barrier to any potential recovery. The EMA20, EMA50, and EMA200 are positioned at $270.30, $266.12, and $265.67 respectively. The distance from these averages indicates a severe market correction, with no immediate reversal signals in sight.
Indicators of Selling Pressure
Additionally, the hourly RSI dipped to an extreme low of 14.97, indicating one of the most significant oversold readings on the standard scale. This suggests that the current selling is more about systematic adjustments rather than panic selling.
Moreover, the price has fallen below the lower Bollinger Band at $221.58, which typically signals either capitulation or a new lower trading range. With a daily Average True Range (ATR) of $16.92, volatility is elevated, suggesting that traders should be cautious of significant price swings.
Future Outlook
Current pivot points indicate limited technical support for IBM in the near term, with the daily pivot point at $215.35, resistance at $219.66, and support at $206.89. The recent trading activity points to a strong institutional repositioning, which could continue to affect IBM's stock performance in the coming days.
This material is informational and should not be considered financial advice.