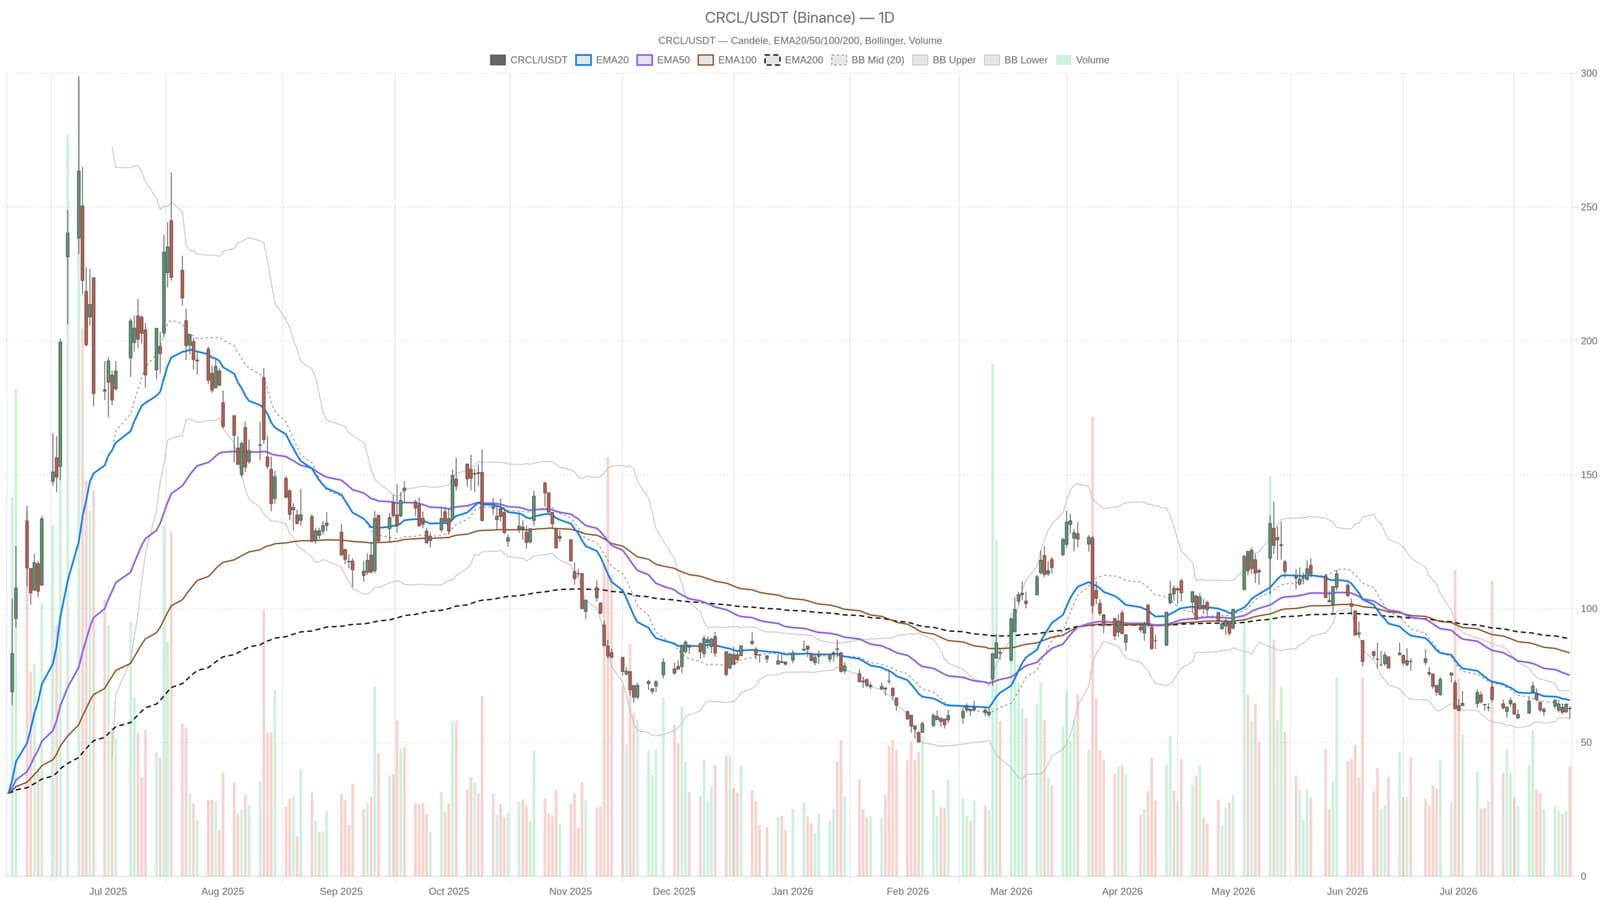
Circle Internet Group’s stock tumbled almost 7%, closing at $62.61 on July 31, even after the company secured a key regulatory milestone with a New York trust charter. The price action defied the optimistic news, with technical indicators pointing to ongoing bearish pressure.
Technical Analysis Shows Persistent Downtrend
On the daily chart, Circle’s stock clearly stays below all major exponential moving averages EMA20 at 65.81, EMA50 at 75.15, and EMA200 at 88.76 signaling strong seller dominance. Each attempt to push prices up to these moving averages has been met with resistance rather than support, reinforcing the downtrend. The Relative Strength Index (RSI14) reads 43.19, under the neutral 50 mark, signaling that selling momentum remains without tipping into oversold territory. also the MACD is confirming this weak but steady decline as its line stays below the signal line, though the increasing histogram suggests momentum may be easing.
Volatility and Support Levels to Watch Ahead of Earnings
Volatility in Circle’s stock has been notably high with the Average True Range (ATR14) at 4.72, significant relative to the current price. Bollinger Bands illustrate this tension as prices cling to the lower band 59.17 with the middle band at 64.27 and top at 69.37. This setup suggests sustained selling pressure but also increases the chance of a bounce back toward the mean in the near term. Key technical levels include a daily support at $59.68 and resistance at $64.53. Traders eyeing Circle ahead of the upcoming Q2 2026 earnings release and further regulatory news should prepare for potential sharp price swings.
This content is for informational purposes only and should not be considered financial advice.