ASML Holding N.V. announced a net profit of €2.9 billion for the second quarter of 2026, surpassing the €2.3 billion recorded during the same period in 2025. This earnings beat comes alongside an increase in full-year guidance, highlighting the company's strong performance in the semiconductor sector.
Market Dynamics and Technical Indicators
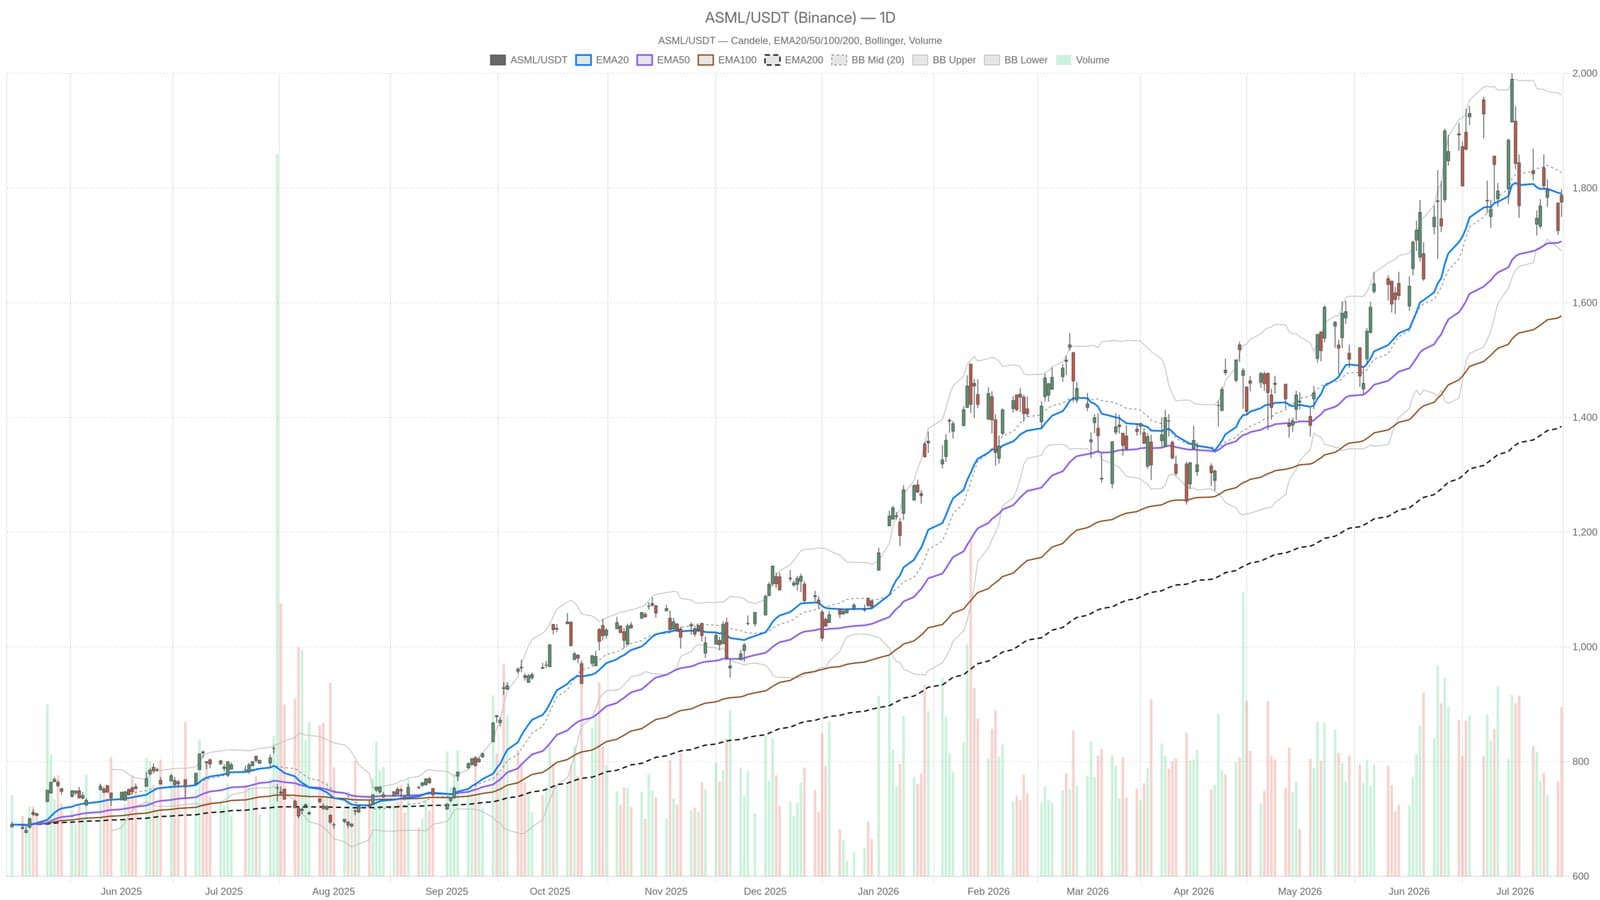
Despite the positive earnings report, ASML's stock is exhibiting a neutral technical bias. The closing price on July 14 was €1,775.64, positioned between the EMA20 resistance level of €1,790.24 and the EMA50 support level at €1,707.20. This positioning indicates a lack of clear directional momentum, as the stock struggles to reclaim the EMA20 resistance, which has become a critical short-term barrier.
Key indicators reflect this indecision. The daily Relative Strength Index (RSI) stands at 50.05 suggesting a balanced momentum, while the MACD histogram at -20.06 signals a waning upward impulse. Although ASML's longer-term trend remains intact, it shows signs of losing energy. The market is currently stuck in a consolidation phase, which could be perceived differently by bulls and bears.
Resistance and Support Levels
ASML's ability to maintain its position hinges on crucial support and resistance levels. The daily pivot point sits at €1,774.59, with resistance at €1,799.32 and support at €1,750.91. A daily close above the €1,790 €1,800 zone could trigger bullish sentiment, while a drop below €1,750 may indicate increased bearish pressure. The current market scenario emphasizes the need for traders to stay vigilant and watch for potential breakouts or breakdowns.
On the hourly chart, ASML's price movements reflect a lack of decisive strength, as it oscillates between key moving averages without a clear momentum signal emerging. The recent hourly close of €1,775.28 mirrors the daily closing figure, further illustrating the lack of directional conviction in the market.
This material is for informational purposes only and should not be considered financial advice.