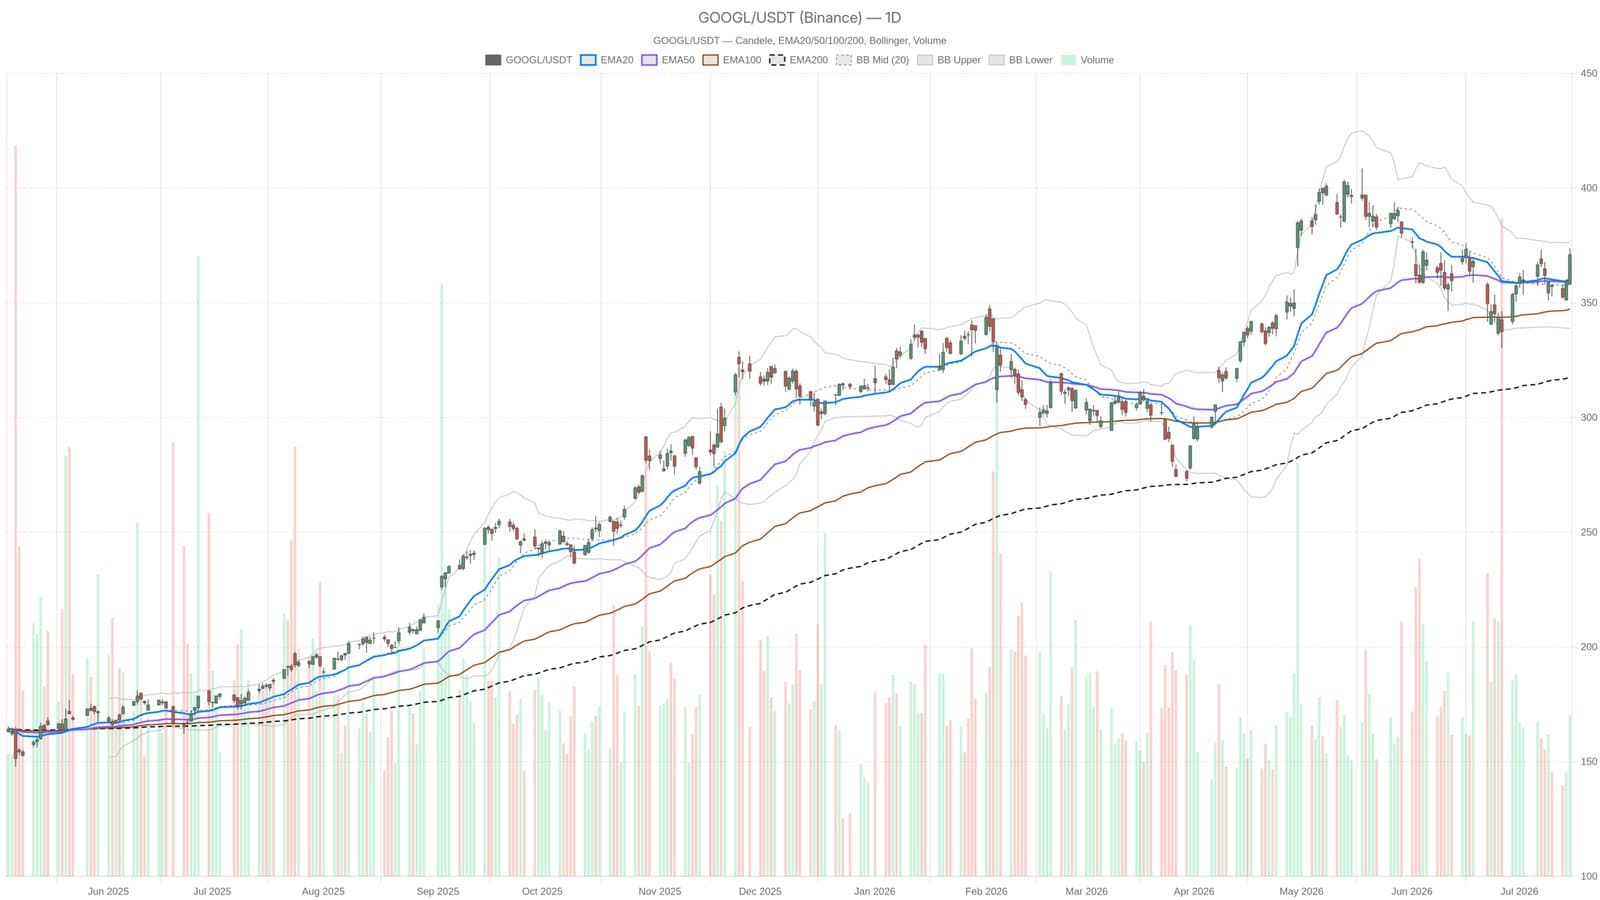
On July 15, Alphabet Inc. shares closed at 370.92, reflecting a solid trading range of 357.76 to 373.65 that indicates strong buying interest. The stock is currently exhibiting a bullish trend, though caution is advised as potential resistance levels loom.
Current Trading Dynamics
With Alphabet Inc. trading above its key moving averages, the daily chart supports the bullish outlook. The stock remains well above the EMA20 at 360.51 and EMA50 at 359.58, demonstrating a sustained upward momentum. Furthermore, the EMA200 at 317.59 confirms the long-term recovery trajectory is still intact. The Bollinger Bands show the price approaching the upper band at 376.50, suggesting increasing volatility and a continuation of the upward trend.
Momentum Indicators Favor Further Gains
The Relative Strength Index (RSI) currently stands at 56.87, indicating that the stock is not yet in overbought territory, leaving room for potential upward movement. Additionally, the MACD histogram has turned positive at 1.48, suggesting improving short-term momentum. This combination of indicators signals that GOOGL could see further price appreciation in the near future.
Resistance is identified at 377.13, aligning closely with the upper Bollinger Band, making it an essential level to monitor. A significant decline below the EMA20 at 360.51 would jeopardize the current bullish structure, signaling a need for caution among investors. Warren Buffett's Berkshire Hathaway has made a substantial bet on Alphabet, with its investment exceeding $31 billion, further solidifying the stock’s positive outlook.
This material is for informational purposes only and should not be considered as financial advice.