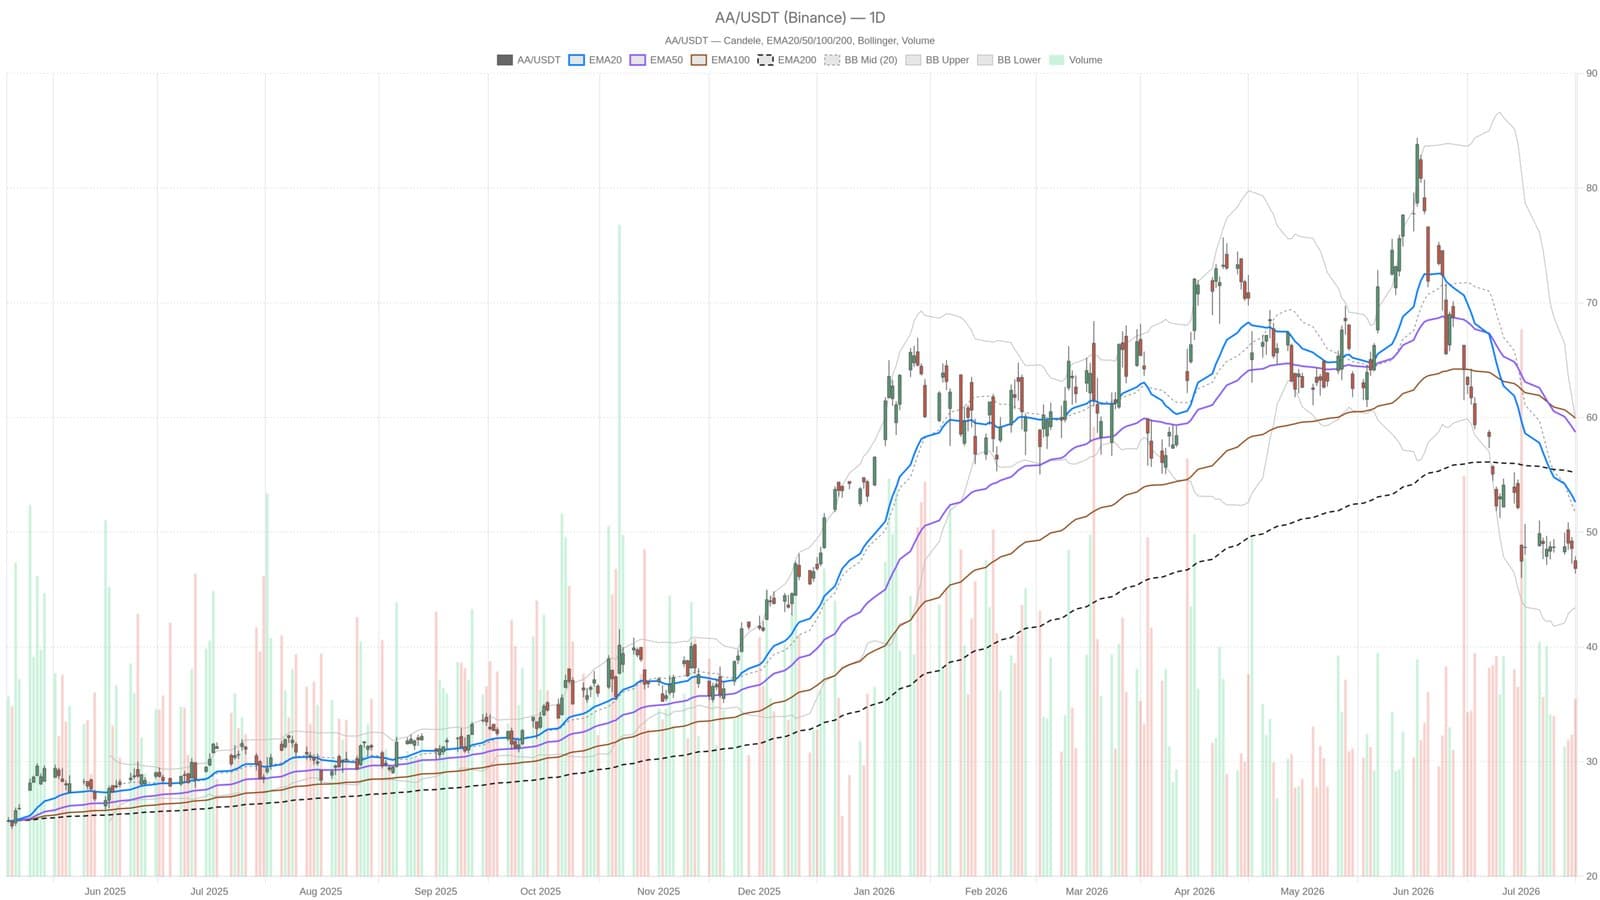
Alcoa Corporation's stock closed at $46.85 on July 16, 2026, indicating a significant downturn as it trades below all major daily moving averages. This bearish momentum is marked by the RSI, which stands at 28.49, placing the stock firmly in oversold territory.
Currently, the stock is underperforming against three key exponential moving averages: EMA20 at $52.63, EMA50 at $58.72, and EMA200 at $55.19. This alignment suggests a persistent downward trajectory rather than a fleeting dip. The daily chart reveals that the selling pressure has been intense and prolonged, but the very low RSI could hint at a potential exhaustion of the downtrend.
Despite the bearish indicators, the MACD histogram has shown a slight uptick to 0.19, which may suggest that the rate of decline is starting to slow. However, the overall daily MACD remains negative, reflecting ongoing weakness. Bollinger Bands further illustrate the situation, with the lower band at $43.43 and the price languishing in the lower third of the range, indicating that recovery to the midline at $51.69 is quite distant.
Daily pivot analysis indicates a pivot point at $47.05, with immediate resistance at $47.70 and support at $46.19. The stock closed just below the pivot, maintaining a marginally negative bias. A close above $47.05 could signal a potential shift worth monitoring.
In the hourly context, the bearish regime continues to prevail, with the RSI showing a reading of 38.48. This suggests that the stock may still have room for further declines before any significant reversal might occur. Investors are looking ahead to the upcoming Q2 earnings report, which could serve as a binary catalyst; a strong performance could trigger short-covering from the oversold levels.
This material is for informational purposes only and is not financial advice.